Human Costs of COVID-19
Human Toll in Cases, Deaths and Exposure
COVID-19 deaths in the United States as of June 24, 2020, with 2.3 million confirmed cases 1
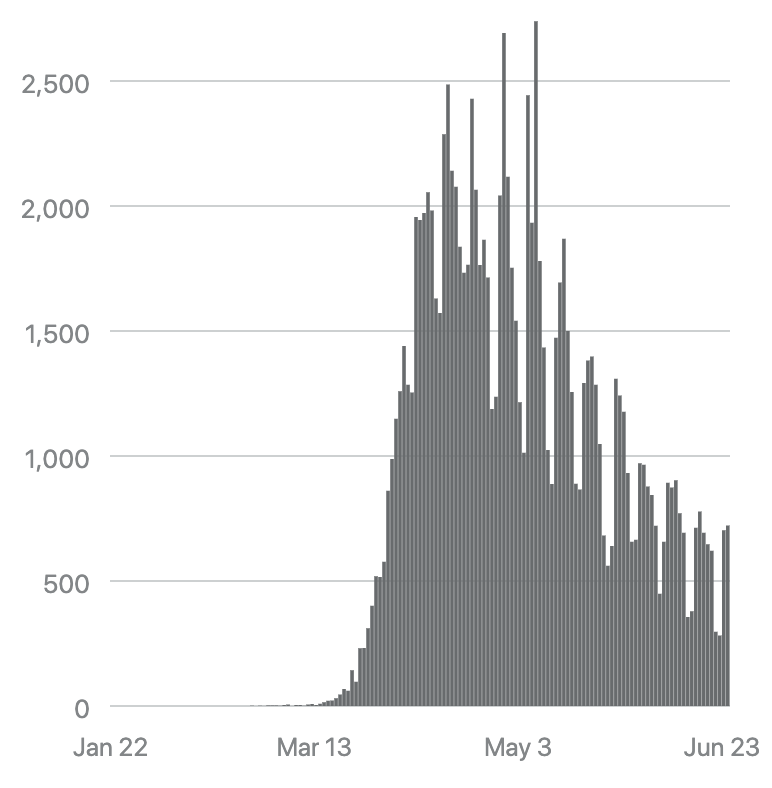 Source: COVID Tracking Project
Worldwide deaths from COVID-19 as of June 24, 2020, with 9.3 million confirmed cases 2
Black lives lost to COVID-19 as a percentage of all lives lost in the U.S. Black people are 13% of the population, and are therefore dying at a rate nearly twice that of others. 3
Number of people tested positive for COVID-19 in the 174,000-person Navajo Nation, the highest infection rate anywhere in the United States 4
Nursing home residents and staff who have died from COVID-19 as of June 11, 2020 5
Minimum number of incarcerated people who were infected with COVID-19 in prisons, jails, and immigration detention centers as of June 24, 2020 6
Number of imprisoned people infected at a single Ohio prison, Marion Correctional Institution 7
Minimum number of incarcerated people who have died from exposure to COVID-19 8
Percentage of imprisoned people sickened by COVID-19 in Tennessee, New Jersey, Michigan, Ohio, Arkansas, Connecticut, and Kansas 9
Minimum number of meatpacking, food processing, and farmworkers who have contracted COVID-19 as of June 24, 2020 10
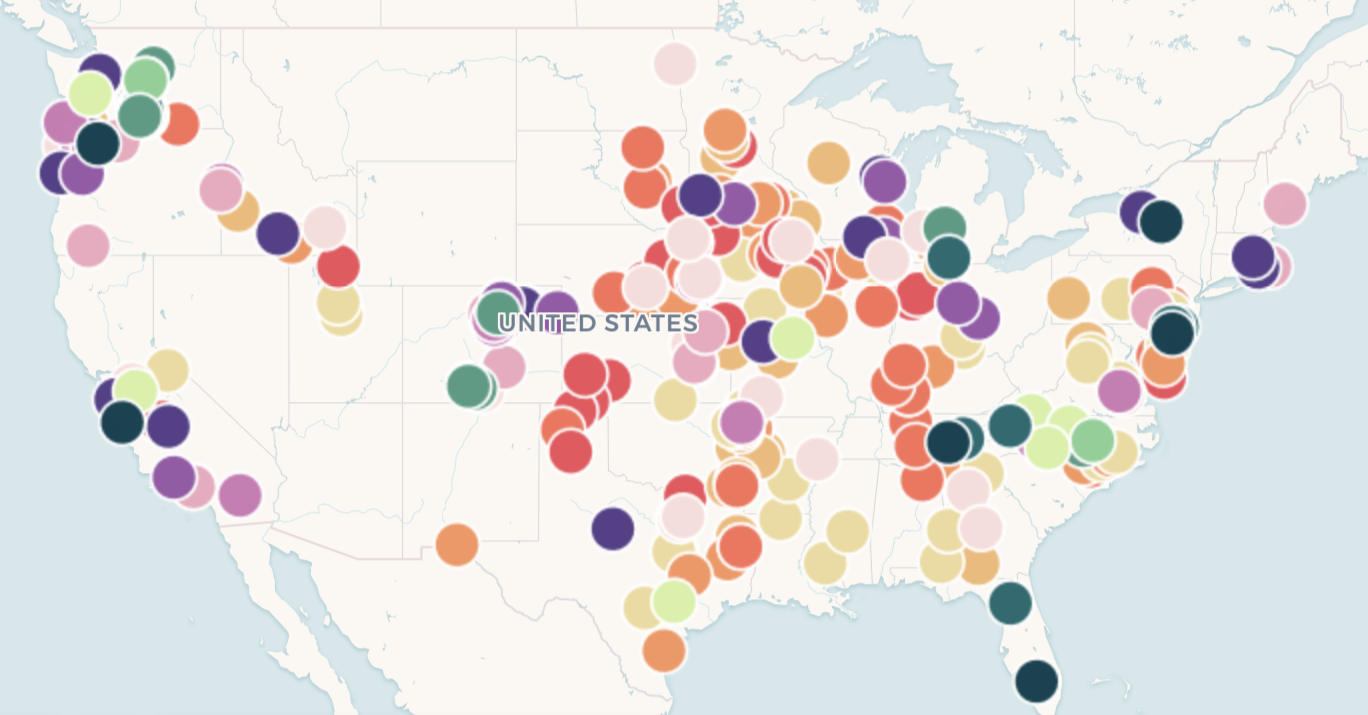 Source: Leah Douglas, The FERN
Number of workers infected at two meat processing plants owned by Smithfield Foods and Tyson Foods 11
Number of people in the United States experiencing homelessness on a typical night, and therefore at high risk of contracting COVID-19 12
Number of people in the United States whose water is shut off in a single year, putting people at high risk of contracting COVID-19 13
Portion of Oklahoma City and Tulsa households whose water was shut off in 2016 14
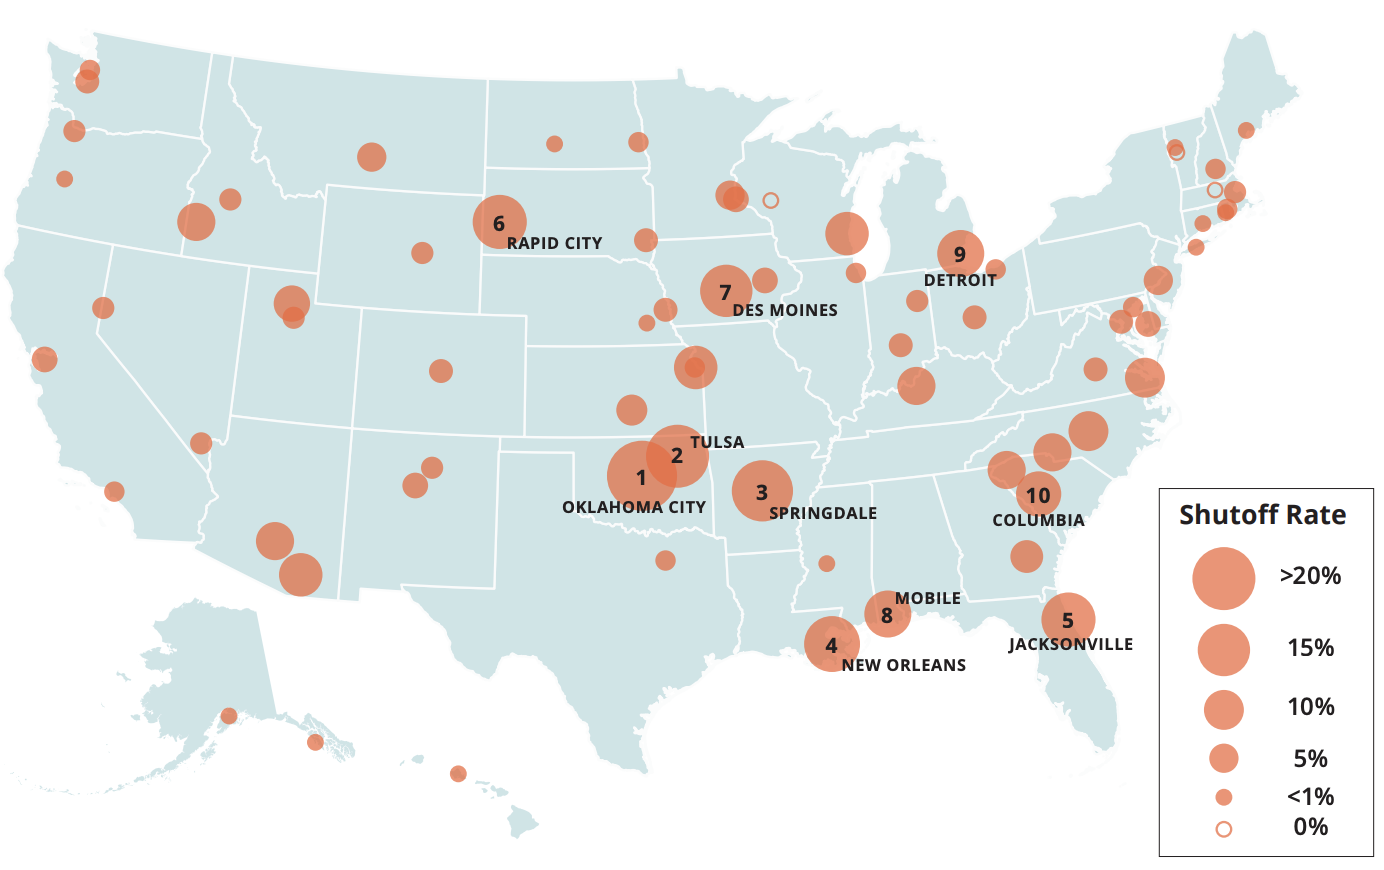 Source: Source: Kaiser Family Foundation
1 Centers for Disease Control (June 10, 2020), “Cases in the U.S."
https://www.cdc.gov/coronavirus/2019-ncov/cases-updates/cases-in-us.html
2 Center for Systems Science and Engineering (June 24, 2020). “COVID-19 Dashboard.” Johns Hopkins University.
https://coronavirus.jhu.edu/map.html
3 The COVID Tracking Project (viewed June 24, 2020). “The COVID Racial Data Tracker.” The Atlantic.
https://covidtracking.com/race
4 Navajo Department of Health (June 24, 2020). “Dikos Ntsaaígíí-19 (COVID-19).”
https://www.ndoh.navajo-nsn.gov/COVID-19
5 Paul, Emily (June 11, 2020). “How to Track COVID-19 Nursing Home Cases and Deaths in Your State.” AARP. https://www.aarp.org/caregiving/health/info-2020/coronavirus-nursing-home-cases-deaths.html. See also CMS, “COVID-19 Nursing Home Data,” https://data.cms.gov/stories/s/COVID-19-Nursing-Home-Data/bkwz-xpvg.
6 Williams, Timothy, Libby Seline & Rebecca Griesbach (June 24, 2020). “Coronavirus Cases Rise Sharply in Prisons Even as They Plateau Nationwide.” New York Times.
https://www.nytimes.com/2020/06/16/us/coronavirus-inmates-prisons-jails.html
7 The New York Times (June 24, 2020). “Coronavirus in the U.S.: Latest Map and Case Count.”
https://www.nytimes.com/interactive/2020/us/coronavirus-us-cases.html
8 The Marshall Project (June 18, 2020). “A State-by-State Look at Coronavirus in Prisons.”
https://www.themarshallproject.org/2020/05/01/a-state-by-state-look-at-coronavirus-in-prisons
10 Douglas, Leah (June 24, 2020). “Mapping Covid-19 outbreaks in the food system.” Food & Environment Reporting Network.
https://thefern.org/2020/04/mapping-covid-19-in-meat-and-food-processing-plants/
12 National Alliance to End Homelessness (2020). “State of Homelessness: 2020 Edition.”
https://endhomelessness.org/homelessness- in-america/homelessness-statistics/state-of-homelessness-2020/
13 Food & Water Watch (2018). “America’s Secret Water Crisis: National Shutoff Survey Reveals Water Affordability Emergency
Affecting Millions.”
https://www.foodandwaterwatch.org/insight/americas-secret-water-crisis
Human Toll in Jobs, Food, Rent and Dollars
Households in which someone lost hours or lost a job because of COVID-19, as of April 29, 2020 15
Anticipated job cuts, April to June, 2020 16
Number of workers in occupations with high risk of layoffs 17
Portion of households with children experiencing food insecurity, late April 2020 (34.5%) 18
Portion of renters worried about how to pay rent, May 2020. 63% of renters reported losing income 19
Estimated number of small businesses that shut down permanently in March and April 2020 20
Number of small businesses at risk of closing through the first five months of the pandemic 21
Decrease in GDP the first and second quarters of 2020 (Q2 is projected) 22
Amount committed by the federal government to economic relief through the CARES Act and the Federal Reserve as of April 2020 23
Amount of additional federal spending economists believe is necessary to meet people’s needs 24
Number of workers expected to lose jobs by the end of 2021 without federal aid to state and local governments 25
15 Montanaro, Domenico "Poll: Half Of Americans Financially Affected By Coronavirus" National Public Radio (April 29, 2020).
https://www.npr.org/2020/04/29/847517729/poll-half-of-americans-financially-affected-by-coronavirus
16 Faria-e-Castro, Miguel (March 24, 2020). "Back-of-the-Envelope Estimates of Next Quarter’s Unemployment Rate" Federal Reserve Bank of St. Louis.
https://www.stlouisfed.org/on-the-economy/2020/march/back-envelope-estimates-next-quarters-unemployment-rate
18 Bauer, Lauren (May 6, 2020). “The COVID-19 Crisis Has Already Left Too Many Children Hungry in America.” The Hamilton Project.
https://www.hamiltonproject.org/blog/the_covid_19_crisis_has_already_left_too_many_children_hungry_in_america.
19 Akala, Adedayo (Apr. 28, 2020), “Only about half of Americans are confident they can pay full rent in May: Survey,” CNBC,
https://www.cnbc.com/2020/04/28/only-half-of-americans-confident-they-can-pay-full-rent-in-may-survey.html.
20 Bartik, Alexander (April 2020). "How Are Small Businesses Adjusting to Covid-19? Early Evidence from a Survey." National Bureau of Economic Research.
https://www.nber.org/papers/w26989.pdf
21 Main Street America (April 9, 2020), “New Report: The Impact of COVID-19 on Small Businesses,”
https://www.mainstreet.org/blogs/national-main-street-center/2020/04/09/new-report-the-impact-of-covid-19-on-small-busines.
22 See Bureau of Economic Analysis (May 28, 2020), "Gross Domestic Product, 1st Quarter 2020 (Second Estimate); Corporate Profits, 1st Quarter 2020 (Preliminary Estimate)"), https://www.bea.gov/news/2020/gross-domestic-product-1st-quarter-2020-second-estimate-corporate-profits-1st-quarter.; Swagel, Phill (April 24, 2020), “CBO’s Current Projections of Output, Employment, and Interest Rates and a Preliminary Look at Federal Deficits for 2020 and 2021,” Congressional Budget Office,
https://www.cbo.gov/publication/56335.
23 Dam, Andrew (April 15, 2020), "The U.S. has thrown more than $6 trillion at the coronavirus crisis. That number could grow" The Washington Post Business Analysis.
https://www.washingtonpost.com/business/2020/04/15/coronavirus-economy-6-trillion/
24 Desmond, Matthew (May 26, 2020), “Can America’s Middle Class Be Saved from a New Depression?” New York Times,
https://www.nytimes.com/interactive/2020/05/26/magazine/coronavirus-milwaukee-unemployment-jobs.html.
25 Bivens, Josh & David Cooper (June 10, 2020), “Without federal aid to state and local governments, 5.3 million workers will likely lose their jobs by the end of 2021,” Economic Policy Institute,
https://www.epi.org/blog/without-federal-aid-to-state-and-local-governments-5-3-million-workers-will-likely-lose-their-jobs-by-the-end-of-2021-see-estimated-job-losses-by-state/.
Hospital Layoffs and Bailouts
No. of health care jobs eliminated in April 2020 during the pandemic as hospitals and other companies, facing revenue losses, laid off workers 26
Federal bailout given to the nation’s 60 largest hospital chains 27
Cash reserves the nations’ 20 largest hospital chains are sitting on 28
Number of workers laid off, furloughed, or having hours cut by the Tenet Healthcare, Mayo Clinic, Trinity Health, Beaumont Health, the Henry Ford Health System in Michigan; SSM Health and Mercy, Fairview Health, and Prisma Health while receiving a bailout of more than $2 billion 29
Federal bailout given to HCA Healthcare alone. HCA made more than $7 billion in profits the last two years, has a net worth of $36 billion, and paid its CEO $26 million in 2019 30
Number of layoffs that would occur in a pandemic if hospitals were publicly financed through global budgets under Medicare for All 31
Percent of their pay that the CEOs of HCA and Tenet Healthcare have committed to returning to help their workers 32
26 “The Employment Situation – April 2020” Bureau of Labor Statistics (May 8, 2020).
https://www.bls.gov/news.release/pdf/empsit.pdf
27 Silver-Greenberg, Jessica, Jesse Drucker and David Enrich (June 8, 2020). “Hospitals Got Bailouts and Furloughed Thousands While Paying C.E.O.s Millions.”
https://www.nytimes.com/2020/06/08/business/hospitals-bailouts-ceo-pay.html.
28 Drucker, Jesse Jessica Silver-Greenberg and Sarah Kliff (May 25, 2012). “Wealthiest Hospitals Got Billions in Bailout for Struggling Health Providers.” New York Times.
https://www.nytimes.com/2020/05/25/business/coronavirus-hospitals-bailout.html.
31 Under Medicare for All, hospitals would receive annual lump-sum payments based on local medical and staffing needs. These payments would eliminate fee-for-service payments, which have allowed hospitals to drive up healthcare costs and led to sudden revenue shortfalls during the pandemic when patients and doctors cancelled many appointments and procedures.
Systemwide Medical Costs
33 Cox, Cynthia "How health costs might change with COVID-19" Peterson-KFF Health System Tracker (April 15, 2020).
https://www.healthsystemtracker.org/brief/how-health-costs-might-change-with-covid-19/
34 “Analysis Estimates Up To 2 Million Uninsured People Could Require COVID-19 Hospitalization” Kaiser Family Foundation (April 7, 2020).
https://www.kff.org/uninsured/press-release/analysis-estimates-up-to-2-million-uninsured-people-could-require-covid-19-hospitalization/
35 Covered California (March 22, 2020), "The Potential National Health Cost Impacts to Consumers, Employers and Insurers Due to the Coronavirus (COVID-19),”
https://hbex.coveredca.com/data-research/library/COVID-19-NationalCost-Impacts03-21-20.pdf
36 "Covid-19 could carry a $200B price tag for hospitals" Advisory Board (May 7, 2020).
https://www.advisory.com/daily-briefing/2020/05/07/covid-finance
37 Grimm, Christi “Hospital Experiences Responding to the COVID-19 Pandemic: Results of a National Pulse Survey March 23–27, 2020” U.S. Department of Health and Human Services (April 2020).
https://oig.hhs.gov/oei/reports/oei-06-20-00300.pdf
Potential Costs Per Patient
Amount Swedish Medical Center billed Michael Flor of Washington State for COVID-19 treatment 38
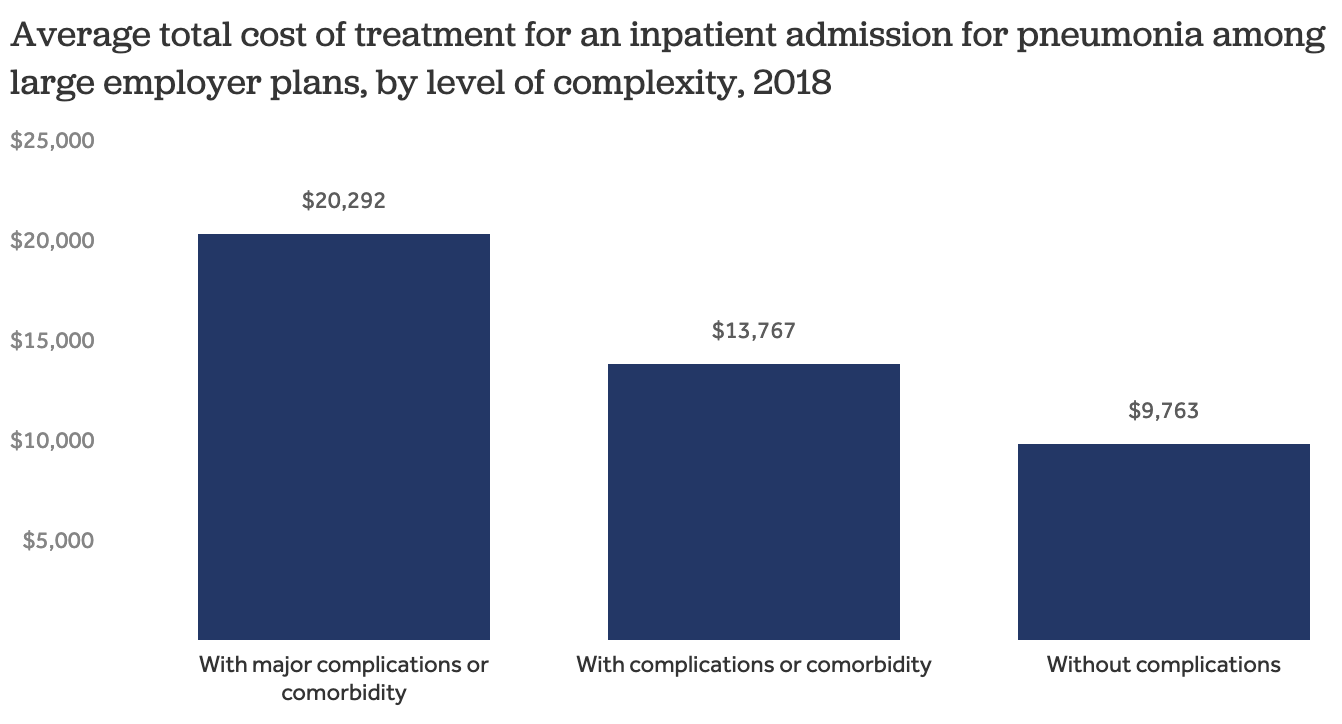
Cost of a hospitalization for pneumonia, 2018 (ranging from no complications or comorbidity to major complications or comorbidity) 39
 Source: Source: Footnote 26
Median cost to an employer-sponsored insurance plan for a hospitalization for pneumonia, 2018 (ranging from no complications or comorbidity to major complications or comorbidity) 40
Average out-of-pocket costs to patients for pneumonia hospitalization, 2018 41
Percentage of pneumonia admissions at in-network hospitals that lead to a surprise out-of-network bill 42
Projected increase in individual and employer premiums in 2021 43
Portion of Americans who would avoid seeking medical care for COVID-19 symptoms because of the cost of treatment 44
38 Westneat, Danny (June 12, 2020). “Coronavirus survival comes with a $1.1 million, 181-page price tag.” Seattle Times.
https://www.seattletimes.com/seattle-news/inspiring-story-of-seattle-mans-coronavirus-survival-comes-with-a-1-1-million-dollar-hospital-bill/.
39 Rae, Matthew (March 13, 2020). “Potential costs of COVID-19 treatment for people with employer coverage” Peterson-KFF Health System Tracker.
https://www.healthsystemtracker.org/brief/potential-costs-of-coronavirus-treatment-for-people-with-employer-coverage/
44 Witters, Dan "In U.S., 14% With Likely COVID-19 to Avoid Care Due to Cost" Gallup (April 28, 2020).
https://news.gallup.com/poll/309224/avoid-care-likely-covid-due-cost.aspx?mod=article_inline