Underinsurance
Health care reforms usually focus on getting ‘coverage’ to the 30 million people who are entirely uninsured. But coverage is only useful if it gives people health care and financial security. Today’s privatized insurance coverage is failing.
What It Means to Be ‘Covered’ but Underinsured
Being underinsured means someone has health insurance coverage, yet is either required to pay more for health care than they can reasonably afford, or that cost barriers, coverage gaps, or narrow networks prevent them from getting the care they need.
1There is a key distinction between ‘coverage’ and ‘care’: expanding health coverage is often mistakenly interpreted as the end goal of health policy, but coverage is only useful if it actually gets people care and does so without decimating their finances. Guaranteeing care, not coverage, should be the real goal of the health care system. And by that measure, today’s health care policies are failing. Every year tens of millions of people are forced to skip necessary medical care, take on insurmountable financial burdens, and make impossible choices between paying for medical care or other basic needs. People on all forms of private and public insurance are being hurt.
Inadequate Coverage Is Pervasive
Number of underinsured adults in the U.S., not counting the 28-30 million who are entirely uninsured. Nearly 3 in 4 of these people are on private plans (not counting millions more on privatized Medicaid and Medicare “managed care” plans). 2

Portion of American families each year in which someone is forced to delay care 4
Portion of underinsured adults who report problems paying medical bills or medical debt (52%) 5
Portion of insured people with major medical bills in the last year who had problems paying those bills. Half of them ended up paying bill they weren’t even sure they owed because the bills were so confusing 6
Portion of underinsured adults who cannot get needed care because of cost 7
No. of U.S. adults every two years (11%) who try to get medical care and are turned away for financial or insurance reasons. Most other people who are forced to delay or skip care are stopped by price barriers before they even try going to the doctor 8
1 The Commonwealth Fund, for example, defines someone as underinsured if their deductibles are more than 5% of their income, their total out-of-pocket costs (not counting premiums) are more than 10 percent of their income, or if their income is under 200% of the federal poverty line and their total out-of-pocket costs are 5% of their income. By this definition, The Commonwealth Fund finds that 45% of adults under the age of 65 are underinsured, yet in the very same survey finds that costs forced 23% of people who are “not underinsured” to skip medical care in the last year and that 25% of “not underinsured” people received unaffordable medical bills, carry medical debt, or had to change their way of life to pay off medical bills. This suggests that 59% of people are underinsured (25% x 55% + 45% = 59%). This expanded estimate falls close to data from the National Health Interview Survey according to Yabroff et al., who define medical financial hardship as “as problems paying medical bills and/or paying off medical bills over time; psychological hardship, as worry about paying costs of serious illness and/or normal health care; and behavioral hardship, as delaying and/or forgoing care due to worry about cost and/or being unable to afford needed care.” They find that 56% of adults 18 and over experience hardship each year. A third measure from the Kaiser Family Foundation comes adults 18-64 if they had to pay for their insurance copays, deductibles or coinsurance was more than they could afford. According to this definition, 75% of U.S. adults under 65 are underinsured. Ultimately there is no perfect definition nor precise data for underinsurance, but it is clear that a significant majority of insured U.S. adults are routinely forced to delay or forgo care because of cost barriers, coverage gaps, or non-covered providers and/or to assume unaffordable out-of-pocket medical costs that are not covered by their plans. See Collins, Sara R., Herman K. Bhupal, and Michelle M. Doty (February 2019), “Health Insurance Coverage Eight Years After the ACA: Fewer Uninsured Americans and Shorter Coverage Gaps, but More Underinsured,” The Commonwealth Fund, https://www.commonwealthfund.org/publications/issue-briefs/2019/feb/health-insurance-coverage-eight-years-after-aca.; Yabroff, K. Robin, Jingxuan Zhao, Xuesong Han, and Zhiyuan Zheng (August 1, 2019 ), “Prevalence and Correlates of Medical Financial Hardship in the USA,” Journal of General Internal Medicine 34, no. 8: 1494–1502, https://doi.org/10.1007/s11606-019-05002-w.; Hamel, Liz, Mira Norton, Karen Pollitz, Larry Levitt, Gary Claxton, and Mollyann Brodie (January 2016), “The Burden of Medical Debt: Results from the Kaiser Family Foundation/New York Times Medical Bills Survey,” Kaiser Family Foundation, https://www.kff.org/report-section/the-burden-of-medical-debt-introduction/.
https://www.kff.org/report-section/the-burden-of-medical-debt-introduction/.
2 Surveying adults under 65, The Commonwealth Fund classifies 43.8 million people as insured all year but underinsured according to the definition in footnote 1, and 48.5 million as “not underinsured” yet have unaffordable medical bills, carry medical debt, or have to change their way of life to pay off medical bills. See Collins et al. (February 2019, footnote 1). In addition, in a separate report, The Commonwealth Fund finds that 11.5 million Medicare beneficiaries are underinsured (including both people over 65 and people with disabilities under 65, but based on the Fund’s narrow definition of underinsurance). (See Schoen, Cathy, Claudia Solís-Román, Nick Huober, and Zachary Kelchner (May 2016), “On Medicare But At Risk: A State-Level Analysis of Beneficiaries Who Are Underinsured or Facing High Total Cost Burdens,” Commonwealth Fund, https://www.commonwealthfund.org/publications/issue-briefs/2016/may/medicare-risk-state-level-analysis-beneficiaries-who-are.) The AARP, meanwhile, finds that 10% of Medicare beneficiaries are forced to delay care due to costs and 10% had problems paying medical bills. (See Noel-Miller, Claire (June 11, 2020), “Medicare Beneficiaries’ Out-of-Pocket Spending for Health Care,” AARP Public Policy Institute, https://doi.org/10.26419/ppi.00105.001.) Ten percent of the Census Bureau’s 65-and-over population is 5.4 million. Using this more conservative estimate, we calculate that 43.8m + 48.5m + 5.4m = 97.7 million are underinsured. In their report, Yabroff et al. (August 1, 2019, footnote 1) find that 137.1 million adults in the U.S experience medical financial hardship each year. To calculate how many insured people experience financial hardship, we can subtract the number of uninsured adults who experienced financial hardship according to Yabroff et al. (1 minus 17.9%), multiple this by the uninsured population from the Census Bureau (27.5 million) to find that 22.6 million uninsured people experience medical financial hardship each year. Subtracting 22.6 million from 137.1 tells us that 114.5 million insured people experience medical financial hardship, very close to our first estimate of 117.1 million. Lastly, we calculate 90 million underinsured people on private insurance by multiplying Yabroff et al.’s 56.4% rate of medical financial hardship for people 18-64 on private insurance plans and 35.2% rate for seniors on both Medicare and private insurance plans by Census Bureau figures (142.291 million 19-64 year-olds on private insurance and 28.848 million 65+ year-olds on both Medicare and private insurance) to calculate that 80m + 10m = 90m. For Census figures, see U.S. Census Bureau, “Table HI05_ACS. Health Insurance Coverage Status and Type of Coverage by State and Age for All Persons: 2019,” https://www.census.gov/data/tables/time-series/demo/health-insurance/acs-hi.html.
4 Hamel, Liz, Cailey Muñana, and Mollyann Brodie (May 2019), “Kaiser Family Foundation/LA Times Survey of Adults with Employer-Sponsored Insurance,”
https://www.kff.org/private-insurance/report/kaiser-family-foundation-la-times-survey-of-adults-with-employer-sponsored-insurance/.
6 Wang, Penelope (August 1, 2018), “Sick of Confusing Medical Bills?” Consumer Reports,
https://www.consumerreports.org/medical-billing/sick-of-confusing-medical-bills/.
7 Collins, Sara, Gunja, Munira and Doty, Michelle, “How Well Does Insurance Coverage Protect Consumers from Health Care Costs?” The Commonwealth Fund (October 18, 2017).
https://www.commonwealthfund.org/publications/issue-briefs/2017/oct/how-well-does-insurance-coverage-protect-consumers-health-care
8 According to NPR et al. (February 2016), footnote 15, 26% of U.S. adults are forced to skip care. 24% of those people (3.6% of all U.S. adults) were turned away. 3.6% of the Census Bureau’s total of 245,770,000 adults 19+ is 8,847,720. See Census Bureau, “Table HI-05_ACS. Health Insurance Coverage Status and Type of Coverage by State and Age for All Persons: 2019,” American Community Survey,
https://www.census.gov/data/tables/time-series/demo/health-insurance/acs-hi.2019.html.
Underinsurance Grew Worse Under the Affordable Care Act
The Affordable Care Act marketplaces insure 3% of the U.S. population, [9] but the premium subsidies and cost-sharing assistance intended to make private insurance plans affordable are too low, [10] are unavailable to middle-income people struggling with insurance prices, and do nothing to help the 97% of the population not on marketplace plans. By failing to control the prices that health care companies charge, failing to adequately fund Medicaid, failing to plug holes in Medicare coverage, and failing to further expand Medicaid and Medicare eligibility, Congress and state governments have decided to make nearly every household and employer pay more and more for health care and have left half the population in precarious straits.
The combined underinsurance-and-uninsurance rate among adults under 65 held essentially even, declining just 1% from 2010 to 2018 as the Affordable Care Act was implemented. Although the number of people uninsured all year fell by 40%, the proportion who are uninsured at some point in the year grew by 25% and the proportion who are underinsured grew nearly 50%. 11
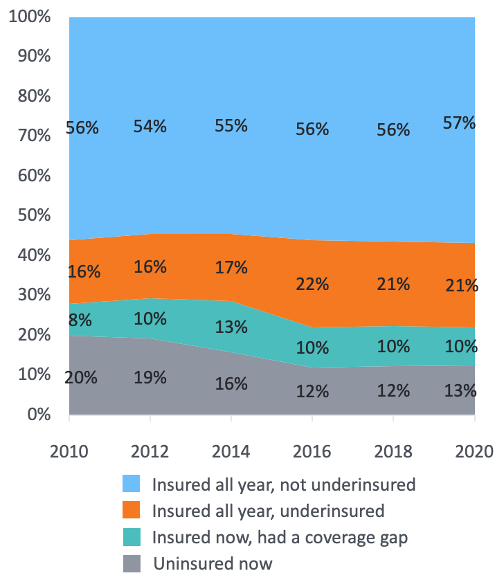 Source: Source: The Commonwealth Fund
Portion of people with individually purchased insurance plans who are underinsured according to one narrow definition 12
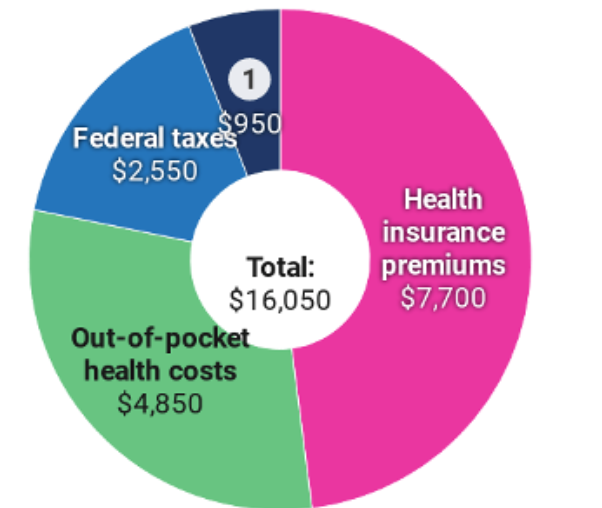
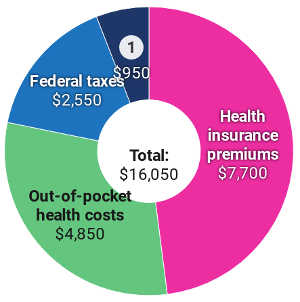
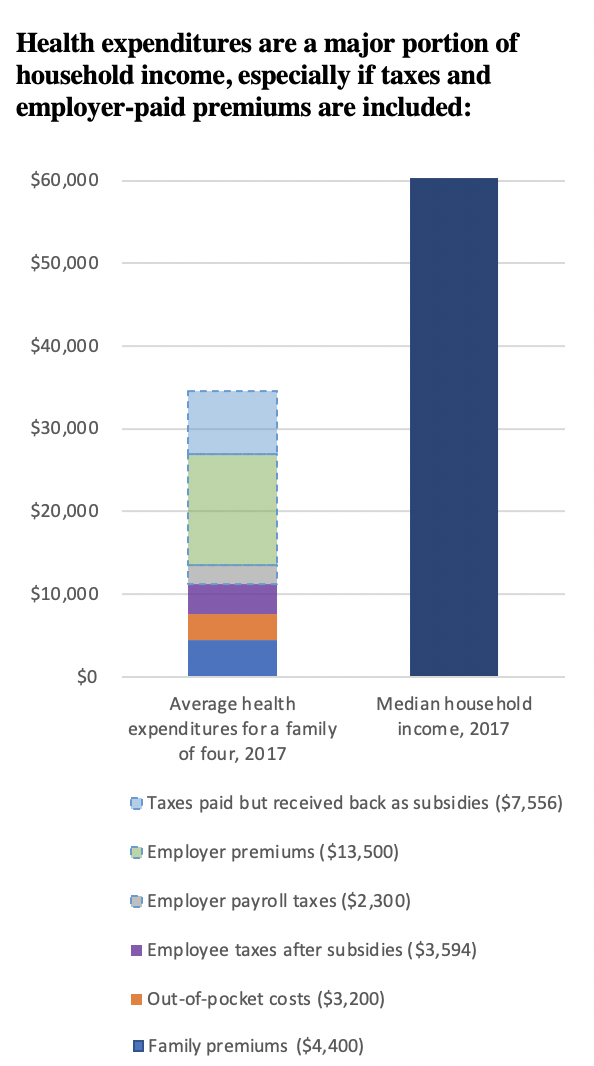
The total amount in 2017 that a typical family of four on an Affordable Care Act plan had to pay for health care, totaling 20% of the average family’s $79,630 income. This includes $7,700 (10% of income) for premiums, $4,850 (6%) for out-of-pocket costs, and $3,500 (4%) for state and federal health care taxes.
 Source: Source: Peterson-KFF Health System Tracker
Percentage of health care costs patients on Affordable Care Act plans are expected to pay on top of insurance premiums: 10% on platinum-rated plans, 20% on gold, 30% on silver, 40% on bronze 13
9 11.4 million of the country’s 330.4 million people are on ACA exchange plans in 2020. See Kaiser Family Foundation, “Marketplace Enrollment, 2014-2020,” https://www.kff.org/health-reform/state-indicator/marketplace-enrollment/.; U.S. Census Bureau, “U.S. and World Population Clock,”
https://www.census.gov/popclock/.
10 Aron-Dine, Aviva & Matt Broaddus (March 21, 2019), “Improving ACA Subsidies for Low- and Moderate-Income Consumers Is Key to Increasing Coverage,” Center on Budget and Policy Priorities,
https://www.cbpp.org/research/health/improving-aca-subsidies-for-low-and-moderate-income-consumers-is-key-to-increasing.
11 Collins, Sara R., Munira Z. Gunja, and Gabriella N. Aboulafia (August 19, 2020), “U.S. Health Insurance Coverage in 2020: A Looming Crisis in Affordability,” The Commonwealth Fund,
https://www.commonwealthfund.org/publications/issue-briefs/2020/aug/looming-crisis-health-coverage-2020-biennial.
13 Centers for Medicare and Medicaid Services, “The ‘metal’ categories: Bronze, Silver, Gold & Platinum,” Healthcare.gov,
https://www.healthcare.gov/choose-a-plan/plans-categories/.
Who’s Underinsured
Nearly three-fourths of people who are underinsured are on private insurance plans, but under current federal and state policy, Medicare and Medicaid leave big coverage gaps too. Women are underinsured more often than men because they tend to need more health care, so they must pay more in out-of-pocket costs even though they are paid less than men.
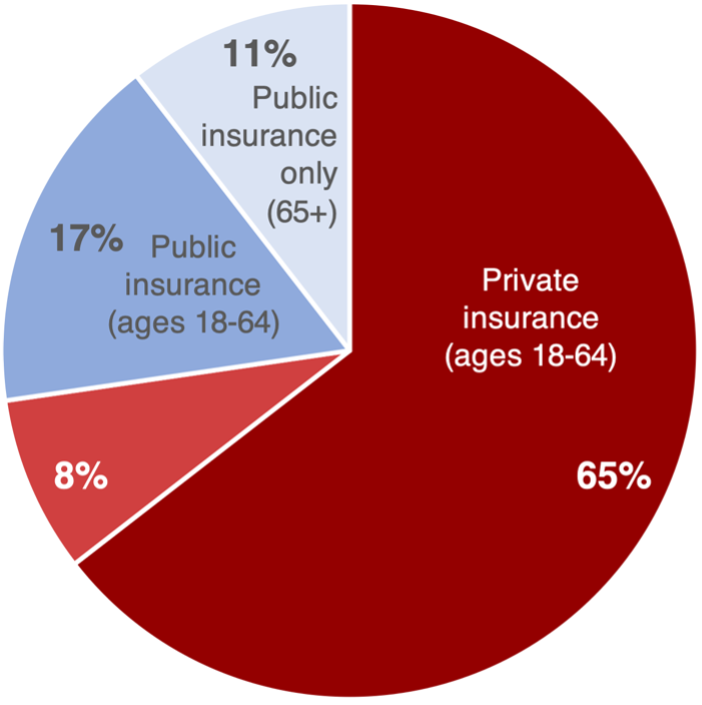
Proportion of underinsured people who have private insurance 14
Proportion of underinsured people who have public insurance 14
Proportion of all people struggling with medical bills who have insurance. Six out of ten have private insurance, one has public insurance, and three are uninsured. 15
Portion of women currently paying off medical bills, versus one in four men. Women are also more likely to have problems paying medical bills, have to delay or forgo care, and have to skip doses of medication or cut pills in half. 16
Women say they or a relative avoided the doctor because of cost concerns 17
For more on who’s underinsured, see the following sections:
15 Pollitz, Karen, "Medical Debt Among People With Health Insurance," Kaiseer Family Foundation (January 7, 2014)
https://www.kff.org/private-insurance/report/medical-debt-among-people-with-health-insurance/
16 Kaiser Family Foundation (March 2018), “Coverage, Access, and Affordability: Key Findings from the 2017 Kaiser Women’s Health Survey,”
http://files.kff.org/attachment/Issue-Brief-Womens-Coverage-Access-and-Affordability-Key-Findings-from-the-2017-Kaiser-Womens-Health-Survey.
Delayed and Forgone Care
Tens of Millions Insured Yet Priced Out of Needed Care
Portion of American families with employer-based insurance each year (51%) in which someone is forced to delay care 18
Portion of all households in which someone was forced to skip care in the last year due to costs 19
Portion of these families who skipped care for a serious medical condition 20
Portion of adults who in the last year were forced to skip dental care, a doctor’s visit and prescription medicine, respectively 21
Portion of seniors forced to skip care each year (8.9%). Thanks to Medicare, seniors have much better health security than the average working-age person, yet Medicare coverage gaps and cost sharing still let too many seniors fall through the cracks 22
Relative jump in the percentage of low-income households (<$40,000 per year) who was forced to delay care for a serious medical condition due to costs from 2018 to 2019, up from 23% to 36% of low-income households 23
Number of insured U.S. adults each year who are forced to skip care because of costs. This is 27% of all insured adults. Another 13 million uninsured people are forced to skip care (51% of uninsured adults). 24
Number of Americans who know someone who died within the last five years because they couldn’t afford care. People of color and low-income people are twice as likely to know someone who died as White people and wealthier people, respectively. People 18-44 are two-and-a-half times as likely to know someone as people over 65, virtually all of whom are covered by Medicare. 25
Average percent of the population that put off care each year due to costs from 2005 to 2018 26
Portion of people forced to skip getting health care who skipped care because the price was too high, they couldn’t find a doctor who’d take their insurance and/or the only providers they could find were too far away and hard to reach, respectively 27
Percent of workers who reported not being very confident they’d be able to get the treatments they needed in 2018. Only one in three were confident they could get care without financial hardship. 28
Copays and Deductibles Block Access to Essential Care
Percent of workers with high-deductible employer-based plans who said they or a family member had to skip care in the last year 29
Percent of workers in high-deductible employer-based plans who have less in available savings than the amount of their deductible 30
Level of outpatient copays that increased costly in-patient visits and hospitalizations among Medicare patients after the copays led patients to skip health care visits and develop more serious medical conditions 31
Decreased likelihood that chronic myeloid leukemia patients will stick to their full course of life-saving medication if they have to pay higher copayments ($53 on average). 17% of patients with these higher copays stop taking their medication altogether. 32
Minimum level of copays that led 8.3% fewer women to get mammograms, especially in high-poverty communities 33
Pct. of adults with high deductibles forced to delay care, versus 18% without high deductibles 34
Percent of people in the highest-deductible plans who said they or a family member with a chronic condition skipped or delayed medical care or prescription drugs for cost reasons in 2017 35
Decrease in men seeking emergency-room care for high-severity medical needs after they switched to a high-deductible health plan, suggesting high deductibles are leading many to avoid seeking critical care. Women did not, on average, reduce visits for high-severity care. 36
Medicine Priced Out of Reach
Number of U.S. adults each year who are forced to skip medicine for serious medical conditions 37
Total number of adults (23%) forced to skip buying medicine in the past year 38
Portion of adults taking regular prescriptions who are forced to cut pills in half or skip doses because medicines and copays are priced too high 39
Percent of prescription medications that carry out-of-pocket costs 40
Number of seniors (14%) each year who skip filling a prescription because of costs. Among seniors with incomes under $20,000 a year, 20% skip prescriptions, and 80% of all seniors’ skipped prescriptions are for serious health conditions. 41
Amount seniors and people with disabilities have to pay out of pocket for medicines before Medicare covers > 75% of the costs of their prescription 42
Percent of those with diabetes who skipped diabetes medication for cost reasons 43
Number of insured adults under 65 who were forced to skip filling a prescription due to costs in the past year. Two-thirds of these people have private insurance, and one-third have Medicaid and/or Medicare. 44
Bonus paid by Celgene to CEO Mark J. Alles in 2017 for boosting profits by tripling the price of life-saving cancer drug Revlimid to $500+ per pill 45
Net revenue captured by Celgene in the U.S. alone from raising the price of Revlimid 22 times from 2009 through 2018. Celgene also netted another $19 billion in international revenue on top of this 46
Dental Care Denied
Portion of people with no dental coverage 47
Portion of seniors with no dental coverage 48
Portion of low-income seniors who visit the dentist each year, less than half the rate of high-income seniors. Both low- and middle-income seniors cited cost barriers as the primary obstacle to care 49
Portion of adults under 200% of the federal poverty line each year who are forced to forgo dental care because of cost barriers. 12% of people whose incomes are 200-400% of the poverty line are similarly barred from care 50
Percent of kids 2-18 who have untreated cavities each year. Black kids are 1.5 times as likely as White kids not get treatment, and kids living in poverty are nearly 3 times as likely as middle- and upper-income kids not to get treatment 51
Higher likelihood kids will miss school and underperforming academically if they have poor oral health 52
Number of states that provide no dental coverage or limited dental coverage for adults on Medicaid 53
Additional costs to states of providing extensive dental benefits to all enrolled adults, as a percentage of total state Medicaid spending 54
Percent of dentists who do not accept Medicaid and CHIP payments, further limiting poor people’s access to dental care. 63% of Black dentists participate in Medicaid/CHIP, but just 39% of White dentists do 55
Hours of work and school hours lost in 2008 to unplanned dental-care emergencies. People who couldn’t afford care were two-and-a-half times as likely to lose work hours, and low-income workers are also less likely to have paid sick time off 56
Number of people who go to the emergency room each year for emergency dental care at a cost of $12 billion in 2012. This is care that could largely be avoided by guaranteeing people preventable dental care 57
Number of adults who gained at least partial dental benefits through Medicaid expansion 58
Who’s Most Often Forced to Skip Care
The sixty million Americans who have health insurance yet are forced to skip care each year come from every part of the country, every political affiliation and all walks of life. Only those from the wealthiest of households is secure, yet not everyone faces equal risk. People in poor health, young adults, people with disabilities, people with lower and moderate incomes, women, parents, and LGBT are all more likely to have to skip care than people in good health, older, able-bodied, wealthier, male, childless, and straight people.
Percent of adults under 65 insured only part of the last year who were forced to delay or skip care due to costs versus those with continuous coverage 59
Percent of lower-income, middle-income and higher-income adults who were forced to skip care in the last year due to costs 60
Percent of women in fair or poor health who were forced to skip care due to costs compared to women in excellent or good health 61
Percent of adults age 18-34, 35-44, and 55+ each year, respectively, who are forced to skip care because of costs 62
Percent of people with disabilities who have delayed care (40%) and unmet care (23%) relative to people without disabilities (24% and 10%, respectively) 63
Percent of people under 65 on private individual plans or Medicaid who were forced to skip care in the last year due to costs compared to the percent on Medicare and the percent on employer-based plans, respectively 64
Percent of low-income (< $25,000), moderate income ($25,000-$75,000) and higher-income individuals ($75,000+) who are forced to skip care each year because of costs. 62% of people struggling to pay monthly had to skip care. 65
Percent of households with incomes under $90,000 each year who are forced to skip care because of costs. Yet no working households are immune: 24% of households with incomes of $90,000 to <$120,000, 19% with incomes of $120,000 to <$180,000 and 13% of households with incomes over $180,000 were also forced to skip care. 66
Percent of women and men, respectively, forced to skip care in the last year because of costs 67
Percent of parents with dependent children forced to skip care in the last year because of costs compared to childless adults 68
Percent of American Indian/Alaska Native people forced to skip care by costs in the last year versus the percent of White people. 26% of Native Hawaiian/Pacific Islander people, 25% of Latinx people, 24% of Black people, and 19% of Asian people were also forced to skip care 69
Portion of people with private individual insurance, private employer-based insurance plans, and Medicaid, respectively, who were forced to skip care due to costs 70
Percent of bisexual women, bisexual men, lesbian women, and gay men who delayed or did not receive care because of cost in 2015. In comparison, 14.1% of straight women and 11.7% of straight men reported delaying care. 71
Percent of Republicans, Democrats, and independents forced to skip care because of costs in the past 12 months, 2019 72
Portion of rural residents who said they have not been able to get health care when they needed it at some point in recent years. Of these people, 45% cited costs as an obstacle, 23% transportation or travel distance, 22% lack of available appointments, and 19% not being able to find a doctor who’d accept their insurance. 73
18 Hamel, Liz, Cailey Muñana, and Mollyann Brodie (May 2019), “Kaiser Family Foundation/LA Times Survey of Adults with Employer-Sponsored Insurance,”
https://www.kff.org/private-insurance/report/kaiser-family-foundation-la-times-survey-of-adults-with-employer-sponsored-insurance/.
19 According to Gallup, 33%, and according to the Federal Reserve, 31%. See Saad, Lydia (December 9, 2019), “More Americans Delaying Medical Treatment Due to Cost,” Gallup, https://news.gallup.com/poll/269138/americans-delaying-medical-treatment-due-cost.aspx.; Board of Governors of the Federal Reserve System (May 2015), “Report on the Economic Well-Being of U.S. Households in 2014,”
https://www.federalreserve.gov/econresdata/2014-report-economic-well-being-us-households-201505.pdf.
22 Robin A. Cohen and Maria A. Villarroel (July 15, 2020), “Selected Financial Burdens of Health Care Among Families With Older Adults, by Family Composition: United States, 2017–2018,” National Health Statistics Report No. 144, National Center for Health Statistics
https://www.cdc.gov/nchs/data/nhsr/nhsr144-508.pdf.
24 These percentage are reported by in et al. Overall, they find, 29% of adults skip a visit, to the doctor or clinic, a test, a treatment, or a prescription. According to the Census Bureau, in 2019, 220,506,676 U.S. adults 19 years and older had insurance and 25,263,570 were uninsured. 27% x 220,506,676 = 59.5 million and 51% x 25,263,570 = 12.9 million. See Lin, Judy T., Tippy Ulicny, Christopher Bumcrot, Gary Mottola, Gerri Walsh, Robert Ganem, Christine Kieffer, and Annamaria Lusardi (June 2019), “The State of U.S. Financial Capability: The 2018 National Financial Capability Study,” FINRA Investor Education Foundation, https://www.usfinancialcapability.org/downloads/NFCS_2018_Report_Natl_Findings.pdf.; U.S. Census Bureau, “Table K202701: Age by Health Insurance Coverage Status,” 2019: ACS Supplemental Estimates Detailed Tables,
https://data.census.gov/cedsci/table?q=insurance&tid=ACSSE2019.K202701&hidePreview=false.
25 Witters, Dan (November 12, 2019 ), “Millions in U.S. Lost Someone Who Couldn’t Afford Treatment,” Gallup,
https://news.gallup.com/poll/268094/millions-lost-someone-couldn-afford-treatment.aspx.
26 Saad, Lydia, “Delaying Care a Healthcare Strategy for Three in 10 Americans,” Gallop (December 17, 2018).
https://news.gallup.com/poll/245486/delaying-care-healthcare-strategy-three-americans.aspx?g_source=link_NEWSV9&g_medium=TOPIC&g_campaign=item_&g_content=Delaying%2520Care%2520a%2520Healthcare%2520Strategy%2520for%2520Three%2520in%252010%2520Americans
27 NPR, Robert Wood Johnson Foundation, and Harvard T.H. Chan School of Public Health (February 2016), “Patients’ Perspectives on Health Care in the United States: A Look at Seven States & the Nation,”
https://media.npr.org/assets/img/2016/02/26/PatientPerspectives.pdf.
28 Fronstin, Paul, “Workers Rank Health Care as the Most Critical Issue in the United States,” Employee Benefit Research Institute (September 24, 2018).
http://). https://www.ebri.org/docs/default-source/ebri-issue-brief/ebri_ib_459_wbs-24sept18.pdf?sfvrsn=531b3e2f_2
29 Kirzinger, Ashley, Cailey Muñana, Bryan Wu and Mollyann Brodie (June 11, 2019), Data Note: Americans’ Challenges with Health Care Costs,” Kaiser Family Foundation
http://, https://www.kff.org/health-costs/issue-brief/data-note-americans-challenges-health-care-costs/.
31 Trivedi, Amal N., Husein Moloo, and Vincent Mor (January 28, 2010), “Increased Ambulatory Care Copayments and Hospitalizations among the Elderly,” New England Journal of Medicine 362, no. 4: 320–28,
https://doi.org/10.1056/NEJMsa0904533.
32 Dusetzina, Stacie, “Cost Sharing and Adherence to Tyrosine Kinase Inhibitors for Patients With Chronic Myeloid Leukemia” Journal of Clinical Oncology (February 1, 2014).
https://ascopubs.org/doi/full/10.1200/JCO.2013.52.9123?url_ver=Z39.88-2003&rfr_id=ori%3Arid%3Acrossref.org&rfr_dat=cr_pub%3Dpubmed&
33 Trivedi, Amal N., William Rakowski, and John Z. Ayanian (January 24, 2008), “Effect of Cost Sharing on Screening Mammography in Medicare Health Plans,” New England Journal of Medicine 358, no. 4: 375–83,
https://doi.org/10.1056/NEJMsa070929
34 Fronstin, Paul “Consumer Engagement in Health Care: Findings From the 2018 EBRI/Greenwald & Associates Consumer Engagement in Health Care Survey,” Employee Benefit Research Institute (December 20, 2018).
http://). https://www.ebri.org/docs/default-source/ebri-issue-brief/ebri_ib_468_cehcs-20dec18.pdf?sfvrsn=effc3e2f_12
35 Hamel, Liz, “Kaiser Family Foundation/LA Times Survey Of Adults With Employer-Sponsored Insurance,” Kaiser Family Foundation (May 2, 2019).
http://). https://www.kff.org/report-section/kaiser-family-foundation-la-times-survey-of-adults-with-employer-sponsored-insurance-executive-summary/
36 Kozhimannil, Katy, “The impact of high-deductible health plans on men and women: an analysis of emergency department care.” National Center for Biotechnology Information (August 1, 2014).
https://www.ncbi.nlm.nih.gov/pmc/articles/PMC4012427/
37 West Health, and Gallup (2019), “The U.S. Healthcare Cost Crisis,”
https://news.gallup.com/poll/248081/westhealth-gallup-us-healthcare-cost-crisis.aspx.
39 40% according to Yeh et al. According to Kirzinger et al., this is equivalent to 29% of all insured adults. See Musich, Shirley, Yan Cheng, Shaohung S. Wang, Cynthia E. Hommer, Kevin Hawkins, and Charlotte S. Yeh (August 2015), “Pharmaceutical Cost-Saving Strategies and Their Association with Medication Adherence in a Medicare Supplement Population,” Journal of General Internal Medicine 30, no. 8: 1208–14, https://doi.org/10.1007/s11606-015-3196-7.; Kirzinger et al. (June 11, 2019), footnote 29.
40 Cohen, Robin, "Strategies Used by Adults Aged 18-64 to Reduce Their Prescription Drug Costs, 2017," Center for Disease Control and Prevention (March 2019)
https://www.cdc.gov/nchs/products/databriefs/db333.htm
41 See West Health and Gallup (2019), footnote .; Stevens, Lance and Lawrence Mallory (April 15, 2019), “U.S. Seniors Pay Billions, yet Many Cannot Afford Healthcare,” Gallup
, https://news.gallup.com/opinion/gallup/248741/seniors-pay-billions-yet-cannot-afford-healthcare.aspx.
42 Medicare Rights Center, “The Part D donut hole,”
https://www.medicareinteractive.org/get-answers/medicare-prescription-drug-coverage-part-d/medicare-part-d-costs/the-part-d-donut-hole
43 Kang, Hyojung, “Cost-related medication non-adherence among U.S. adults with diabetes,” National Center for Biotechnology Information (June 23, 2018).
https://www.ncbi.nlm.nih.gov/pmc/articles/PMC6204232/
45 (cite according to her Committee testimony however House committees are usually cited, but add this link as the URL) Congresswoman Katie Porter (September 30, 2020)
https://twitter.com/RepKatiePorter/status/1311422510530007041
46 U.S. House of Representatives Committee on Oversight and Reform (September 30, 2020), “Drug Pricing Investigation: Celgene and Bristol Myers Squib—Revlimid,”
https://oversight.house.gov/sites/democrats.oversight.house.gov/files/Celgene%20BMS%20Staff%20Report%2009-30-2020.pdf
47 29% according to AHRQ and and 33.6% according to the ADA’s Health Policy Institute. See Manski, Richard (November 2017), “Dental Services: Use, Expenses, Source of Payment, Coverage and Procedure Type, 1996-2015,” Agency for Healthcare Research and Quality, https://meps.ahrq.gov/data_files/publications/rf38/rf38.shtml.; Health Policy Institute (November 2017), “Dental Benefits Coverage in the U.S.,” https://www.ada.org/~/media/ADA/Science%20and%20Research/HPI/Files/HPIgraphic_1117_3.pdf?la=en.
https://meps.ahrq.gov/data_files/publications/rf38/rf38.shtml
48 Collins, Sara R., Herman K. Bhupal, and Michelle M. Doty (February 2019), “Health Insurance Coverage Eight Years After the ACA: Fewer Uninsured Americans and Shorter Coverage Gaps, but More Underinsured,” Commonwealth Fund,
https://www.commonwealthfund.org/publications/issue-briefs/2019/feb/health-insurance-coverage-eight-years-after-aca.
49 American Dental Association Health Policy Institute (September 2016), “Oral Health and Well-Being Among Seniors in the United States,”
https://www.ada.org/en/science-research/health-policy-institute/publications/infographics
50 American Dental Association Health Policy Institute (November 2017), “Cost Barriers to Dental Care in the U.S.,”
https://www.ada.org/en/science-research/health-policy-institute/publications/infographics
51 Centers for Disease Control and Prevention (July 25, 2018), “Prevalence of Total and Untreated Dental Caries Among Youth: United States, 2015–2016,”
https://www.cdc.gov/nchs/products/databriefs/db307.htm.
52 Ruff, Ryan Richard, Sashendra Senthi, Stephanie R. Susser, and Atsuko Tsutsui (February 1, 2019), “Oral Health, Academic Performance, and School Absenteeism in Children and Adolescents: A Systematic Review and Meta-Analysis.” The Journal of the American Dental Association 150, no. 2: 111-121.e4.
https://doi.org/10.1016/j.adaj.2018.09.023.
53 “Medicaid Adult Dental Benefits: An Overview.” Center for Healthcare Strategies, Inc. (September 2019).
https://www.chcs.org/media/Adult-Oral-Health-Fact-Sheet_091519.pdf
54 American Dental Association Health Policy Institute (December 2018), “Medicaid Expansion and Dental Benefits Coverage,”
https://www.ada.org/en/science-research/health-policy-institute/publications/infographics.
55 American Dental Association Health Policy Institute (August 2020), “Dentist Participation in Medicaid or CHIP,”
https://www.ada.org/en/science-research/health-policy-institute/publications/infographics.
56 Kelekar, Uma, and Shillpa Naavaal (January 11, 2018 ), “Hours Lost to Planned and Unplanned Dental Visits Among US Adults,” Preventing Chronic Disease 15
https://doi.org/10.5888/pcd15.170225.
57 Pew Charitable Trusts, “Dental Campaign,”
https://www.pewtrusts.org/en/projects/dental-campaign.
61 Ranji, Usha, Caroline Rosenzweig, and Alina Salganicoff (March 2018), “Coverage, Access, and Affordability: Key Findings from the 2017 Kaiser Women’s Health Survey,” Kaiser Family Foundation,
http://, https://www.kff.org/womens-health-policy/issue-brief/womens-coverage-access-and-affordability-key-findings-from-the-2017-kaiser-womens-health-survey/
63 Henning-Smith, Carrie, Donna McAlpine, Tetyana Shippee, and Michael Priebe (November 2013), “Delayed and Unmet Need for Medical Care Among Publicly Insured Adults With Disabilities,” Medical Care 51, no. 11: 1015.
https://doi.org/10.1097/MLR.0b013e3182a95d65.
69 Artiga, Samantha and Kendall Orgera (November 12, 2019), “Key Facts on Health and Health Care by Race and Ethnicity,” Kaiser Family Foundation
http://, https://www.kff.org/report-section/key-facts-on-health-and-health-care-by-race-and-ethnicity-coverage-access-to-and-use-of-care/
70 Tepper, Taylor, “Most Americans are worried about their health insurance — especially women,” Bankrate (August 8, 2018).
https://www.bankrate.com/insurance/health-insurance-survey-august-2018/
71 Dahlhamer, James, “Barriers to Health Care Among Adults Identifying as Sexual Minorities: A US National Study,” National Center for Biotechnology Information (June 2016).
https://www.ncbi.nlm.nih.gov/pmc/articles/PMC4880242/
73 “Life in Rural America: Part II,” NPR, the Robert Wood Johnson Foundation, and the Harvard T.H. Chan School of Public Health
(May 2019).
https://media.npr.org/documents/2019/may/NPR-RWJF-HARVARD_Rural_Poll_Part_2.pdf
Financial Burdens Shift Costs onto Families, Especially Sick and Poor People
As hospitals and drug companies drive health care prices ever higher and insurance companies generate enormous administration costs—and profits—American families are forced to pay more and more each year in both insurance premiums and out-of-pocket costs like deductibles, coinsurance and charges for uncovered care. When all these costs are combined with the income and payroll taxes that finance public health care programs, working families are spending 20-30% of their incomes on health care every year. Just about everyone who’s insured benefits from the taxes they pay—people either get coverage through Medicare, Medicaid, the Veterans Administration or another public program or benefit from huge tax subsidies of employer-based and other private insurance plans—but insurance premiums, out-of-pocket costs, Medicare taxes and tax subsidies are all regressive. This shifts the costs of financing the American health care system from the healthy and wealthy onto people who are chronically ill or disabled, people recovering from severe injuries and people with lower incomes. Although the poor pay the most of their incomes, nearly all middle-income households are precarious, insecure and struggling too.
For more on how these financial burdens materialize in people’s lives, see our fact sheet on Medical Debt at dignityandrights.org/HealthStatistics.
Households’ Rising Health Expenditures
Nationwide per capita health care expenditure in 2020, a 5.2% increase from 2019 (outpacing growth in personal income and GDP) 74
Average per-capita health expenditures across the next 10 countries with the highest spending in the world in 2019, half the cost of the U.S. 75
Highest per-capita health care spending in the world 76
Total annual health care expenditures for the typical family of four on employer-based insurance before tax subsidies in 2017. The family paid $18,750 directly: $4,400 on premiums, $3,200 on out-of-pocket expenses and $11,150 on federal and state taxes for health care. Employers pay another $13,050 in premiums (much of which would otherwise be received by workers in the form of wages) plus $2,300 in Medicare taxes. 77
Average federal tax subsidies for a family of four on employer-based insurance (combining deductions for employee and employer premiums, but not counting deductions for health savings accounts, flexible spending accounts or itemized health expenditures). These subsidies cost a total of $291-324 billion in 2020, and are delivered primarily to upper-income households. 78
Net annual cost of health care for a family of four on employer-based insurance after tax subsidies 79
Health expenditures are a major portion of household income, especially if taxes and employer-paid premiums are included:
 Source:
Portion of the average family of four’s annual health expenses that go to insurance companies’ administrative costs and profits (13.2% of insurance companies’ revenue in 2020). On top of this, providers have to hire extra administrative staff to bill multiple insurers, and pass these costs onto households, employers and the government. This redundant billing and administration add up to 8.5% of all hospital spending, 13% of physician spending and 10% of spending at clinics or other providers. 80
Average month-to-month increase in health expenses for the typical family of four with employer-based insurance from 2008 through 2018 81
Projected annual increase in national health expenditures, 2020 to 2030, significantly outpacing anticipated projected average annual income growth of 3.5 to 3.9% 82
Combined cost of employee and premiums plus out-of-pocket costs for a typical family of four in 2020 83
Projected cost of employee and employer premiums plus out-of-costs in 2024 84
Out-of-Pocket Charges Cost Thousands a Year
Out-of-pocket costs—including copayments, deductibles and out-of-network fees charged on people’s insurance plans and also direct payments from patients to medical providers for uncovered care—are growing every year. Legal limits on out-of-pocket costs far exceed what most families are able to afford and don’t apply to out-of-network medical providers. And these are only direct medical costs: many people dealing with injuries and illnesses lose hours, jobs and income.

Average price a family of 4 will have to pay for out-of-pocket expenses on healthcare in 2018 86
Portion of adults (39%) who cannot afford an unexpected medical bill of $400. 27% would have to borrow money or sell something to afford the bill, and 12% wouldn’t be able to afford it at all. 87
Percent of adults who could not come up with $1,000 for a medical bill within thirty days. Three out of four of these people are insured. 88
Total nationwide out-of-pocket expenditures, 2020 89
Percent of a low-income families’ income devoted to out-of-pocket medical costs, versus 5% for higher-income families 90
Median out-of-pocket expense seniors living past age 95 have to pay after they pass their 70th birthday. The 95th percentile has to pay an average of $269,000. 91
Out-of-pocket maximum allowed by the Affordable Care Act for in-network care on family plans in 2020. There is no limit on out-of-network billing. 92
Average out-of-pocket costs among families declaring bankruptcy for medical reasons, 2007 93
Increase in the dollar amount of out-of-pocket costs for insured patients from 2012 to 2016 94
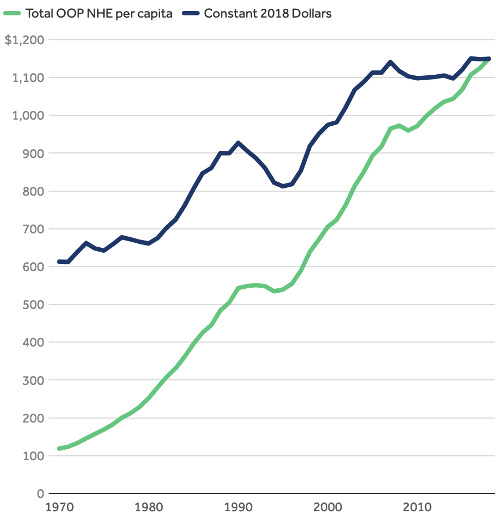
Degree by which out-of-pocket costs outpaced inflation from 1970 to 2018 95
 Source: Source: Peterson-KFF Health System Tracker
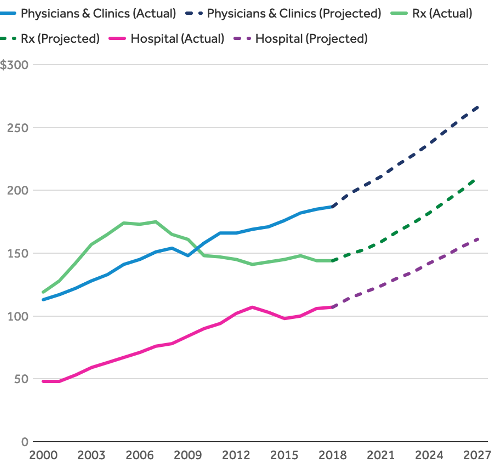
Projected increases in physician, drug and hospital spending, 2020-2027 96
 Source: Source: Peterson-KFF Health System Tracker
Portion of households that say out-of-pocket drug costs are a significant financial burden on their household. 10% say the burden is “extremely significant.” 97
Deductibles Grow Higher and Higher
Percent of people in high-deductible health plans who have less in available savings than the amount of their annual deductible. The same is true of 56% of people in high-deductible plans. 98
Percent of people in high-deductible plans who could not pay off a sudden medical bill without going into debt 99
Percent increase in the average health insurance deductible for covered workers from 2008 to 2018 100
Workers enrolled in a high-deductible plan who reported they don’t have enough savings to cover the deductible in 2019 101
Average deductible among workers with employer-based individual insurance plans in 2018 102
Average deductible in 2020 on employer-based family plans with higher premiums and lower deductibles 103
Average deductible on high-deductible employer-based family plans in 2020 104
Portion of insured workers with a deductible in 2017 105
Increase in the percent of employees enrolled in health plans with a deductible between 2010 and 2016 106
Workers had a deductible greater than $1,000 as of 2017 107
Increase in the average amount of the annual deductible between 2010 and 2016 108
Increased amount of annual deductibles in job-based health plans from 2007 to 2019 109
Coverage Gaps and Cost Shifting Hurt People with Chronic Illnesses or Disabilities and Poor People the Most
Cost sharing adds insult to injury for sick and poor people, heaping the biggest financial burdens for financing the health care system onto people who are already struggling with medical challenges or who simply don’t have enough money to pay for health care and their other basic needs. For healthy, higher income people who don’t need much care, copays and deductibles don’t seem like that big a deal, but they add up quickly for people who need hospitalization, multiple visits to the doctor or clinic, or multiple tests, prescriptions, or procedures. A huge number of people with cancer and other chronic diseases end up in financial distress, and poor people are required to pay a much higher percent of their income into the health care system than the rich. And that’s only direct medical costs: many people dealing with injuries and illnesses lose hours, jobs and income, and families of patients with the most severe injuries and illnesses often also have to pay thousands of dollars for transportation, lodging and food to stay close to their loved one or pay for equipment, supplies or renovations to enable them to care for a newly disabled loved one.
Amount people in poor health have to pay out of pocket to finance the health care system relative to people in excellent health 110
Percent of new cancer patients who lose their entire life savings within two years of diagnosis 111
Percent of cancer patients in debt because of their treatment from 1998–2014 112
Average amount a cancer patient lost from 1998–2014 113
Median lost wages for patients or their families while undergoing treatment for malignant brain tumors 114
Average annual health care expenditures cancer patients have to pay for out of their income or savings or by taking on medical debt 115
Percent of cancer patients who had to quit working while undergoing treatment from 1998–2014. Without adequate unemployment and disability benefits, people have to struggle with losing income on top of their illness. And for many people, losing a job means losing health insurance too. 116
Percent of people with disabilities under 65 on Medicare who had problems with medical bills in the last year, compared to 42% on individual insurance plans, 35% on Medicaid, and 32% on employer-based plans 117
Average amount patients with type 1 diabetes on high-deductible health plans have to pay out-of-pocket for insulin, medical supplies, and related expenses on top of their health insurance premiums each year. 1 in 4 have to pay more than $4,119. 118
Portion of annual income the poorest and wealthiest households have to pay for insurance and out-of-pocket medical expenses each year 119
Reduction in income for the poorest 10% of households and the wealthiest 10% after paying insurance and medical costs 120
Total national income redistributed from poorer households to wealthier ones each year by regressive health insurance premiums and out-of-pocket costs (1.37% of total income) 121
Number of people pushed into poverty or near-poverty (<150% of the federal poverty line) each year by insurance and medical costs 122
Average out-of-pocket costs as a percent of annual income for the lowest-income 20% and highest-income 20% of American households 123
Average insurance premiums and out-of-pocket costs as a percent of annual income for the lowest-income 20% and highest-income 20% of American households 124
Percent of Black, Latinx, White and Asian people whose families had problems with medical bills within the last 12 months 125
Portion of total annual income that the most cost-burdened tenth of Medicare beneficiaries have to spend on out-of-pocket health care costs 126
Portion of total annual income that the most cost-burdened tenth of low-income Medicare beneficiaries (less than 200% of the poverty line) has to spend on out-of-pocket health care costs 127
Average medical out-of-pocket medical expenses for elderly individuals and couples, respectively, in the last five years before death 128
Portion of seniors who have to pay more for out-of-pocket medical expenses than they have in non-housing assets in the last five years they’re alive. 25% have to pay more than their total assets. 129
Portion of women currently paying off medical bills, versus one in four men. Women are also more likely to have problems paying medical bills, have to delay or forgo care, and have to skip doses of medication or cut pills in half. 130
74 Centers for Medicare and Medicaid Services, “Table 01 National Health Expenditures and Selected Economic Indicators,” National Health Expenditure Data (Projected),
http://), https://www.cms.gov/Research-Statistics-Data-and-Systems/Statistics-Trends-and-Reports/NationalHealthExpendData/NationalHealthAccountsProjected
75 Organisation for Economic Co-operation and Development, “Health Spending,”
https://data.oecd.org/healthres/health-spending.htm
77 Estimates come from the Peterson-KFF Health System Tracker and from the Census Bureau, which reports that the median income for a family of four in 2017 was $60,338. Milliman provides a similar estimate: workers and employers paid a combined total of $33,010 for insurance premiums and out-of-pocket health expenditures on the average employer-based family plan in 2020. This includes $28,654 for medical expenses charged by hospitals, drug companies and other providers plus $4,357 for insurance companies’ profits and administrative fees. ($28,653 / (1 – .0132) = $33,010. $33,010 – $28,653 = $4,357.) See Peterson Center on Healthcare & Kaiser Family Foundation, “Household Health Spending Calculator,” Peterson-KFF Health System Tracker, https://www.healthsystemtracker.org/indicator/access-affordability/out-of-pocket-spending/.; U.S. Census Bureau (September 13, 2018), “New American Community Survey Statistics for Income, Poverty and Health Insurance Available for States and Local Areas,” https://www.census.gov/newsroom/press-releases/2018/acs-1year.html.; Girod, Chris, Paul Houchens, Dave Liner, Andrew Naugle, Doug Norris and Scott Weltz (May 2020), “2020 Milliman Medical Index,”
https://us.milliman.com/en/insight/2020-Milliman-Medical-Index.
78 Peterson-KFF Health Tracker reports that the typical family on employer-based insurance paid $11,150 in federal and state taxes in 2017 and spent $4,400 on premiums, and employers spent another $13,050 on premiums. Assuming a federal tax bracket of 22%, a state bracket of 6%, employer and employer FICA taxes of 7.65% each, and that absent employer-based insurance, employer premiums would otherwise be paid to employees in the form of taxable wages, the tax deduction for employer-based premiums saves the average family $7,556: ($4,400 + $13,050) * (.22 + .06 + .765*2) = $7,556. Estimates from the CBO yield a very similar figure: $288 in nationwide spending on tax deductions for employer-based insurance divided by 155 million people on employer-based plans = $1,858 per capita, and 4 x $1,858 = $7,432 for the average family of four. The Tax Policy Center, meanwhile, estimates that all health tax subsidies total $324 billion in 2020, and the CBO estimates that premium deductions for employer-sponsored and self-insurance (but not including tax deductions for health savings accounts, flexible spending accounts, or itemized health expenditures) cost $291 billion. See Peterson Center on Healthcare & Kaiser Family Foundation, footnote 77; Mermin, Gordon, Matthew Buettgens, Clare Pan, and Robin Wang (January 13, 2020), “Reforming Tax Expenditures for Health Care,” Tax Policy Center, https://www.urban.org/sites/default/files/publication/101515/reforming_tax_expenditures_for_health_care.pdf.; Congressional Budget Office (September 2020), “Federal Subsidies for Health Insurance Coverage for People Under 65: 2020 to 2030,”
https://www.cbo.gov/publication/56650.
80 CMS reports that insurance companies took 13.2% of premiums for administrative overhead and profits in 2018. Based on the Peterson-KFF data in footnote 71, ($4,400 + $13,500) * 13.2% = $2,303. The 8.5%, 13% and 10% are estimated by the Center for American Progress based on analyses from the National Academies of Medicine and other sources. See Centers for Medicare and Medicaid Services, “Table 20 Private Health Insurance Benefits and Net Cost,” National Health Expenditure Data (Historical), https://www.cms.gov/Research-Statistics-Data-and-Systems/Statistics-Trends-and-Reports/NationalHealthExpendData/NationalHealthAccountsHistorical.; Gee, Emily and Topher Spiro (April 8, 2019), “Excess Administrative Costs Burden the U.S. Health Care System.” Center for American Progress,
https://cdn.americanprogress.org/content/uploads/2019/04/03105330/Admin-Costs-brief.pdf.
81 Girod, Chris, Sue Hart, and Scott Weltz (May 21, 2018), “2018 Milliman Medical Index,”
https://www.milliman.com/en/insight/2018-milliman-medical-index.
82 The CBO estimates that providers, insurance companies and employers will increase private health insurance spending per enrollee by 5% a year through 2030, and CMS projects growth in national health expenditures of 5.1% in 2021 followed by rates of 5.5% to 5.8% from 2022 through 2028. See Congressional Budget Office (September 2020, footnote ) and Centers for Medicare and Medicaid Services (“Table 1,” footnote ).
85 Hamel, Liz, “The Burden of Medical Debt: Results from the Kaiser Family Foundation/New York Times Medical Bills Survey,” Kaiser Family Foundation (January 5, 2016).
https://www.kff.org/health-costs/report/the-burden-of-medical-debt-results-from-the-kaiser-family-foundationnew-york-times-medical-bills-survey/view/print/
86 Paavola, Alia, “$28k: The average price a family of 4 will spend on healthcare in 2018,” Becker’s Hospital Review (June 4, 2018).
https://www.beckershospitalreview.com/finance/28k-the-average-price-healthcare-will-cost-a-family-of-4-in-2018.html
87 Board of Governors of the Federal Reserve System (May 2019), “Report on the Economic Well-Being of U.S. Households in 2018,”
https://www.federalreserve.gov/publications/files/2018-report-economic-well-being-us-households-201905.pdf.
88 Collins, Sara, "Americans’ Confidence in Their Ability to Pay for Health Care Is Falling," To the Point, Commonwealth Fund (May 10, 2018)
https://www.commonwealthfund.org/blog/2018/americans-confidence-their-ability-pay-health-care-falling
89 Centers for Medicare and Medicaid Services, “Table 3 National Health Expenditures by Source of Funds,” National Health Expenditure Data (Projected)
https://www.cms.gov/Research-Statistics-Data-and-Systems/Statistics-Trends-and-Reports/NationalHealthExpendData/NationalHealthAccountsProjected.
90 Out-of-pocket health fees cost families below 200% of the federal poverty line nearly 14% of annual income, while they cost families with incomes of 200% to 400% of the poverty line 8% of income and families over 4 times the poverty line 5% of income. See Claxton, Gary Bradley Sawyer, and Cynthia Cox (April 14, 2019), “How affordability of health care varies by income among people with employer coverage,” Peterson-KFF Health System Tracker,
https://www.healthsystemtracker.org/brief/how-affordability-of-health-care-varies-by-income-among-people-with-employer-coverage/#item-start.
91 Sudipto Banerjee (April 3, 2018), “Cumulative Out-of-Pocket Health Care Expenses After the Age of 70,”
https://www.ebri.org/health/publications/issue-briefs/content/cumulative-out-of-pocket-health-care-expenses-after-the-age-of-70
92 “Out-of-pocket maximum/limit.” Healthcare.gov (2020).
https://www.healthcare.gov/glossary/out-of-pocket-maximum-limit/#:~:text=For%20the%202019%20plan%20year,and%20%2415%2C800%20for%20a%20family.
94 Chernew, Michael E, and Jonathan Bush (May 4, 2017), “As Patients Take On More Costs, Will Providers Shoulder The Burden?” Health Affairs Blog,
https://www.healthaffairs.org/do/10.1377/hblog20170504.059950/full/.
95 Peterson-KFF Health System Tracker, “Out-of-pocket spending,”
https://www.healthsystemtracker.org/indicator/access-affordability/out-of-pocket-spending/.
96 Kamal, Rabah, Bradley Sawyer, Daniel McDermott and Nisha Kurani (December 20, 2019), “How much is health spending expected to grow?” Peterson-KFF Health System Tracker,
https://www.healthsystemtracker.org/chart-collection/much-health-spending-expected-grow/#item-start
102 “2018 Employer Health Benefits Survey,” Kaiser Family Foundation (October 3, 2018).
https://www.kff.org/health-costs/report/2018-employer-health-benefits-survey/
105 Claxton, Gary, “Employer Health Benefits 2017 Annual Survey,” The Kaiser Family Foundation and Health Research & Educational Trust (2017).
http://files.kff.org/attachment/Report-Employer-Health-Benefits-Annual-Survey-2017
106 “The Burden Of Health Care Costs For Working Families a State-Level Analysis,” Leonard Davis Institute of Health Economics (April 2019).
https://unitedstatesofcare.org/wp-content/uploads/2019/04/Penn-LDI-and-US-of-Care-Cost-Burden-Brief_Final-1.pdf
110 $1,205 average expenses versus $396 in 2016. See Peterson Center on Healthcare & Kaiser Family Foundation, “Out-of-pocket spending,” Peterson-KFF Health System Trackjer,
https://www.healthsystemtracker.org/indicator/access-affordability/out-of-pocket-spending/
111 Gilligan, Adrienne, “Death or Debt? National Estimates of Financial Toxicity in Persons with Newly-Diagnosed Cancer,” The American Journal for Medicine (October 1, 2018).
https://www.amjmed.com/article/S0002-9343(18)30509-6/fulltext
114 Kumthekar, Priya, Becky V. Stell, Daniel I. Jacobs, Irene B. Helenowski, Alfred W. Rademaker, Sean A. Grimm, Charles L. Bennett, and Jeffrey J. Raizer (June 2014), “Financial Burden Experienced by Patients Undergoing Treatment for Malignant Gliomas.” Neuro-Oncology Practice 1, no. 2: 71–76.
https://doi.org/10.1093/nop/npu002.
115 Park, Joohyun, and Kevin A. Look (January 2019), “Health Care Expenditure Burden of Cancer Care in the United States.” INQUIRY: The Journal of Health Care Organization, Provision, and Financing 56
https://pubmed.ncbi.nlm.nih.gov/31583928/
118 Chua, Kao-Ping, Joyce M. Lee, and Rena M. Conti (June 1, 2020), “Out-of-Pocket Spending for Insulin, Diabetes-Related Supplies, and Other Health Care Services Among Privately Insured US Patients With Type 1 Diabetes.” JAMA Internal Medicine 180, no. 7: 1012.
https://doi.org/10.1001/jamainternmed.2020.1308.
119 Annual health expenditures include health insurance, medical services, drugs and medical supplies. Calculated as a percent of post-tax income for households with incomes below $15,000 and those $200,000 or more. See Bureau of Labor Statistics (2020), “Table 1203. Income before taxes: Annual expenditure means, shares, standard errors, and coefficients of variation,” 2019 Consumer Expenditure Surveys,
https://www.bls.gov/cex/tables.htm.
120 Christopher, Andrea S., David U. Himmelstein, Steffie Woolhandler and Danny McCormick (March 2018), “The Effects of Household Medical Expenditures on Income Inequality in the United States,” American Journal of Public Health 108, no. 3: 351–54.
https://doi.org/10.2105/AJPH.2017.304213
121 1.37% according to Christopher et al. In 2019, according to the BEA, US GDP was $21.43 trillion. Because gross national product equals gross national income, 1.37% x $21.43 trillion = $293.6 billion in income transferred from the poor to the wealthy. See Christopher et al. (March 2018), footnote 113; Bureau of Economic Analysis (January 30, 2020), “Gross Domestic Product, Fourth Quarter and Year 2019 (Advance Estimate),”
https://www.bea.gov/news/2020/gross-domestic-product-fourth-quarter-and-year-2019-advance-estimate#:~:text=Current%2Ddollar%20GDP%20increased%204.1,table%201%20and%20table%203
123 Ketsche, Patricia, E. Kathleen Adams, Sally Wallace, Viji Kannan, and Harini Kannan (2015), “The Distribution of the Burden of US Health Care Financing,” International Journal of Financial Research 6, no. 3: p29.
https://doi.org/10.5430/ijfr.v6n3p29
125 Cha, Amy E. and Robin A. Cohen (February 2020), “Problems Paying Medical Bills, 2018,” National Center for Health Statistics, Centers for Disease Control and Prevention
https://www.cdc.gov/nchs/products/databriefs/db357.htm
128 Kelley, Amy S., Kathleen McGarry, Sean Fahle, Samuel M. Marshall, Qingling Du, and Jonathan S. Skinner (2010), “Out-of-Pocket Spending in the Last Five Years of Life,” National Bureau of Economic Research Bulletin on Aging and Health, no. 2: 3,
https://www.ncbi.nlm.nih.gov/pmc/articles/PMC3612877/pdf/nihms-313129.pdf.
130 Kaiser Family Foundation (March 2018), “Coverage, Access, and Affordability: Key Findings from the 2017 Kaiser Women’s Health Survey,”
http://files.kff.org/attachment/Issue-Brief-Womens-Coverage-Access-and-Affordability-Key-Findings-from-the-2017-Kaiser-Womens-Health-Survey.
Employer-Based Insurance’s Cost Burdens and Coverage Gaps
Employer-based insurance is often touted as the gold standard of health security in the United States, yet people on employer-based plans face big challenges. Workers and employers pay huge and mounting health care costs, more than swallowing up any wage gains. Yet despite all that they’re paying, workers face coverage gaps and eligibility restrictions, the threat of unaffordable bills and medical debt, the burden of having to “choose” between multiple plans that impose major costs and don’t meet their needs, and the very real possibility of losing both their jobs and their insurance. Tens of millions of workers are underinsured and living in medical and financial precarity.
Too Much of Workers’ Income Goes to Health Care
Average cost of employer-based health insurance paid directly by employees through premiums and out-of-pocket costs. A significant portion of employer-paid premiums are also indirect employee costs that would otherwise be received in the form of higher pay. 131
Total premiums and out-of-pocket costs the 10% most cost-strained workers had to pay in 2017 132
Workers’ average premiums and deductibles for employer-based insurance as a percentage of annual income across states, ranging from a low of 7.8% in Hawaii to a high of 15.5% in Louisiana 133
States in which the combined costs of workers’ premiums and deductibles outpaced wage growth from 2008 through 2018. The combined cost rose from 7.8% to 11.5% of middle-income workers’ income. 134
Average combined employee-and-employer premiums in 2020 for the average family, for the average family of four and for average individual on employer-based insurance 135
Portion of family plans for which annual employee-and-employer premiums exceed $28,000 per year 136
Number of states in which total premiums on the average family exceeded 30% of median household income by 2016 137
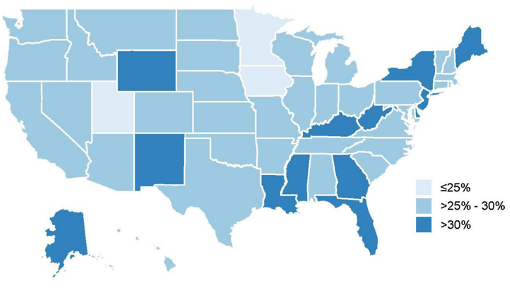 Source: Source: Penn LDI & United States of Care
Average worker share of annual premiums for family plans in 2020. Premiums for the lowest-paid workers average $8,439, while for the highest-paid they average $6,192. 138
Average family-plan premiums for the 10% of workers with the highest premiums 139
Percent of workers on employer-based insurance who pay no monthly premiums 140
Average portion of premiums employees pay directly for family plans 141
Increase in premiums for employer-based insurance plans from 2008 to 2018. Workers’ earnings increased over the same period by 26% 142
Increase in the average premium for family coverage from 2015 to 2020, outpacing increases in both worker earnings (15%) and inflation (10%) 143
Percent of employee + employer premiums workers must pay to stay enrolled in their health insurance through COBRA when they leave a job 144
Average annual cost of COBRA premiums for workers with family plans after leaving a job. Average premiums for individual plans cost $7,012 145
Deductibles and Other Out-of-Pocket Costs Add Up
On top of insurance premiums, working families spend thousands of dollars a year in out-of-pocket health care costs to doctors, hospitals, clinics, pharmacies and retailers of medical equipment and supplies. These deductibles, coinsurance, copayments and bills for uncovered care cost the average family thousands of dollars. Out-of-pocket spending is an extremely regressive form of health care financing: as described above (see “Coverage Gaps and Cost Shifting Hurt People with Chronic Illnesses or Disabilities and Poor People the Most”), sick and poor people bear much heavier costs than the healthy and wealthy.
Percent of insured workers who have to pay a deductible in 2020 (83%) 146
Portion of workers with coinsurance for hospital admissions and outpatient surgery (65%) 147
Portion of workers unsatisfied with out-of-pocket costs for uncovered health care services 148
Increase in deductible amounts in job-based health plans from 2007 to 2019 149
Average deductible for a single worker with employer-based insurance in 2018 150
Average deductible for single small-business employees in 2020 151
Average deductible for family plans in 2020 among employees on HMO, PPO and POS health plans with lower deductibles 152
Average deductible on high-deductible family plans in 2020 153
Total out-of-pocket costs the 10% most cost-strained workers had to pay in 2017 154
Allowable out-of-pocket maximums for family plans in 2020 under federal law 155
Average out-of-pocket costs among families declaring bankruptcy for medical reasons, 2007 156
Coverage Gaps, Narrow Networks and Barriers to Care
Insured adults under 65 each year who receive an unexpected medical bill 157
Portion of adults under 65 with private insurance each year who are forced to skip care each year due to costs (31%). In comparison, 22% of people on Medicaid are forced to skip care. 158
Portion of employees with insurance from big employers each year who are billed for out-of-network care 159
Unaffordable Bills and Medical Debt
Portion of workers with employer-based plans who cannot afford a $500 medical bill 162
Percent of workers with employer-based plans who said they struggled to pay medical bills within the last 12 months. Even more, 51%, said they or a family member had to skip care. 163
Percent of Medicaid enrollees who struggled to pay medical bills in the last 12 months—half as often as people with private insurance 164
Percent of adults under 65 on employer-based plans who faced problems with medical bills within the last year 165
Percent of adults under 65 on employer-based plans who are in medical debt. For most of these people, the debt is over $2,000, and for 10% it’s over $10,000. 166
47% of workers’ health care costs increased from 2017 to 2018, and of those 25% were forced to borrow money to pay medical bills. (This study didn’t report how many people whose costs held steady nevertheless had to borrow money.) 167
The Burden of "Choice" Between Private Plans
Proponents of private insurance argue that workers and patients are better off choosing between different insurance plans with different costs and different coverage, but it’s impossible for people to anticipate their future medical needs. Most people simply want to know they and their families will be able to get care when they need and won’t have to go broke in the process. Having to choose between multiple plans that don’t cover all of one’s medical needs is no choice at all.
Percent of employees who reported that their employer or benefits company provided no education or advice on benefits in 2018 168
Percent of people with employer coverage who said they had difficulty understanding how much they had to pay out-of-pocket in 2018 169
People with employer coverage said it was difficult to find out how expensive medical treatments would be in 2018 170
Workers Lose Coverage as They Change Jobs or Their Jobs Are Cut

Percentage of people on an employer plan in Michigan who were not on that same plan a year later 172
Number of people who lost insurance because of a job loss to the COVID-19 pandemic from March 1 to May 2, 2020. 31 million workers filed for unemployment, and 78 million people were in families in which someone lost a job. 173
Most Workers Aren’t Enrolled in Insurance Through Their Own Employers, and Many Are Uninsured
Fewer than half of workers are enrolled in insurance plans through their employers. Some of these workers have alternative coverage, often through a spouse, but many do not. Nearly half of employers don’t provide health benefits, employers who offer health benefits nevertheless declare one in five workers ineligible and many workers who have the option of coverage can’t afford to enroll or simply find the enrollment process too confusing. And most people who work outside of traditional employment—temp workers, unpaid caregivers, freelancers and others—don’t have the possibility of employer-based insurance at all.
Percent of U.S. workers enrolled in health plans with their own employers 174
Percent of kids who are enrolled in employer-based insurance plans 175
Percent of employers that offer no health benefits. (Because most large employers offer health benefits, 89% of workers are employed at firms that offer at least minimal benefits. Many of these workers don’t enroll in their employer’s health plan because their employer deems them ineligible based on their job description or work hours, they have other coverage or the cost sharing is more than they can afford.) 176
Percent of workers who work at employers that provide no health benefits of any kind. The rate is 31% among non-union workers (versus just 4% among unionized workers), 48% among employees of small businesses, 50% among service workers, 73% among the lowest-wage workers and 76% among part-time workers. 177
Percent of workers at employers that provide health benefits who are not enrolled 178
Number of workers eligible for an insurance plan through their employer who are nevertheless uninsured, usually because the plan is more than they can afford 179
Percent of workers at employers that offer some workers health benefits, but who are ineligible to receive benefits 180
Percent of workers who get no dental coverage through their employer. 73% of small-business employees and 90% of the lowest-paid workers get no dental benefits. 181
Percent of employed workers not offered health insurance by their employer in 2018. 42% of food and accommodations workers’ employers and 33% of retail workers’ employers offer no insurance. 182
Percent of small firms that did not offer health benefits in 2019 183
Percentage of private-sector employers with fifty or fewer workers who offered insurance in 2014 but not in 2015 184
Employers Are Stretched Too
Most employers pay the lion’s share of health premiums for workers and often for their families, while insurance, hospital and drug companies keep driving premiums higher and higher. Small businesses and nonprofits are especially stretched, but all employers are feeling the strain. Nor are employers the only ones paying for all of this: much of the money that employers are pumping into insurance premiums would arguably otherwise go to workers in the form of higher pay. In addition, because the federal government spends hundreds of billions of dollars subsidizing employer-based health insurance, and the federal, state and local governments are having to pay increasing amounts for their employees’ health care, the public ends up paying more and more each year as health care companies drive up premiums.
Average employer premium in 2020 185
Increase in private employers’ premiums, 2015-2020 186
Projected increase in employers’ premiums, 2020-2028 187
The cost of employee health care is the top problem cited by small-business owners. 74% say the cost of employee health care is a problem, and 44% say it’s major. 188
Percent of workers covered by “self-insured” plans in which the employer, rather than the government or an insurance company, assumes the risk that one or more employees will need major medical treatment. Self-insured employers run the risk of bankruptcy, and states have no legal authority to regulate self-insured employer plans. 189
Amount paid by state governments in 2013 for state employees’ health care. State and local governments provide essential health benefits to workers and retirees, thanks to hard-won fights by public employees’ unions, yet these benefits are always under budgetary attack. Under Medicare for All, the federal government would assume responsibility for financing health care, relieving both state and local governments and workers of this burden and precarity. 190
132 Hayes, Susan L., Sara R. Collins and David C. Radley (May 23, 2019), “How Much U.S. Households with Employer Insurance Spend on Premiums and Out-of-Pocket Costs: A State-by-State Look,” The Commonwealth Fund,
https://www.commonwealthfund.org/publications/issue-briefs/2019/may/how-much-us-households-employer-insurance-spend-premiums-out-of-pocket.
133 Collins, Sara R., and David C. Radley (December 7, 2018), “Cost of Employer Insurance Growing Burden Middle-Income Families,” The Commonwealth Fund,
https://doi.org/10.26099/mf87-p820.
134 Collins, Sara R., David C. Radley, and Jesse C. Baumgartner (November 2019), “Trends in Employer Health Care Coverage, 2008–2018: Higher Costs for Workers and Their Families,” The Commonwealth Fund,
https://www.commonwealthfund.org/publications/2019/nov/trends-employer-health-care-coverage-2008-2018
135 Gary Claxton, Matthew Rae, Gregory Young, Daniel McDermott, Heidi Whitmore, Jason Kerns, Jackie Cifuentes, Anthony Damico, and Larry Strange (October 8, 2020), “Employer Health Benefits: 2020 Annual Survey,” Kaiser Family Foundation, https://www.kff.org/health-costs/report/2020-employer-health-benefits-survey/.; Girod et al. (May 2020)
137 Penn Leonard Davis Institute of Health Economics and United States of Care (April 2019), “The Burden of Health Care Costs for Working Families: A State-Level Analysis,”
https://ldi.upenn.edu/brief/burden-health-care-costs-working-families.
138 See table 13 in U.S. Bureau of Labor Statistics (September 2020), “National Compensation Survey: Employee Benefits in the United States, March 2020,”
https://www.bls.gov/ncs/ebs/benefits/2020/employee-benefits-in-the-united-states-march-2020.pdf.
144 Pollitz, Karen, Rabah Kamal, Rachel Fehr and Greg Young (May 28, 2020), “Key Issues Related to COBRA Subsidies,” Kaiser Family Foundation,
https://www.kff.org/private-insurance/issue-brief/key-issues-related-to-cobra-subsidies/.
150 “2018 Employer Health Benefits Survey,” Kaiser Family Foundation (October 3, 2018).
https://www.kff.org/health-costs/report/2018-employer-health-benefits-survey/
156 Himmelstein, David U., Deborah Thorne, Elizabeth Warren, and Steffie Woolhandler (2009), “Medical Bankruptcy in the United States, 2007: Results of a National Study,” The American Journal of Medicine 122, no. 8: 6,
https://www.amjmed.com/article/S0002-9343%2809%2900404-5/pdf.
157 Pollitz, Karen, Matthew Rae, Gary Claxton, Cynthia Cox, and Larry Levitt (June 20, 2019), “An Examination of Surprise Medical Bills and Proposals to Protect Consumers from Them,”
https://www.healthsystemtracker.org/brief/an-examination-of-surprise-medical-bills-and-proposals-to-protect-consumers-from-them-3/.
158 Blumenthal, David Blumenthal, Sara R. Collins Collins, Michelle M. Doty Doty, Sophie Beutel Beutel, and Munira Z. Gunja Gunja (April 27, 2017), “How Medicaid Enrollees Fare Compared with Privately Insured and Uninsured Adults: Findings from the Commonwealth Fund Biennial Health Insurance Survey, 2016,” The Commonwealth Fund,
https://doi.org/10.15868/socialsector.27290.
163 36% according to The Commonwealth Fund and 40% according to the Kaiser Family Foundation. See Gunja, Munira Z., Sara R. Collins, David Blumenthal, Michelle M. Doty and Sophie Beutel (April 2017), “How Medicaid Enrollees Fare Compared with Privately Insured and Uninsured Adults: Findings from the Commonwealth Fund Biennial Health Insurance Survey, 2016,” The Commonwealth Fund, https://doi.org/10.15868/socialsector.27290.; Kirzinger et al. (June 11, 2019), footnote 29.
168 Greenwald, Lisa, “The State of Employee Benefits: Findings From the 2018 Health and Workplace Benefits Survey,” Employee Benefit Research Institute (January 10, 2019).
https://www.ebri.org/docs/default-source/ebri-issue-brief/ebri_ib_470_wbs2-10jan19.pdf?sfvrsn=c5db3e2f_8
171 Graves, John. “The Evolving Dynamics of Employer‐Sponsored Health Insurance: Implications for Workers, Employers, and the Affordable Care Act”. The Milbank Quarterly (December 19th, 2016).
https://onlinelibrary.wiley.com/doi/abs/10.1111/1468-0009.12229
172 Austic, Elizabeth (November 2016), "Insurance Churning," University of Michigan Poverty Solutions,
https://poverty.umich.edu/research-publications/policy-briefs/insurance-churning/
173 Garfield, Rachel “Eligibility for ACA Health Coverage Following Job Loss” Kaiser Family Foundation (May 13th, 2020). https://www.kff.org/coronavirus-covid-19/issue-brief/eligibility-for-aca-health-coverage-following-job-loss/. For comparative estimates of workers losing coverage (not counting dependents), see Economic Policy Institute:
https://www.epi.org/blog/16-2-million-workers-have-likely-lost-employer-provided-health-insurance-since-the-coronavirus-shock-began/.
174 73% of workers work at firms that offer health benefits. Of those workers, 82% of employees eligible to enroll in employers’ health plans. Of those, 78% enroll. Ultimately 64% of employees. See Table 9 of U.S. Bureau of Labor Statistics (September 2020), footnote , and Figure 3.1 of Claxton et al. (October 2020), footnote 105.
175 Alker, Joan and Alexandra Corcoran (October 2020), “Children’s Uninsured Rate Rises by Largest Annual Jump in More Than a Decade,” Georgetown University Health Policy Institute Center for Children and Families,
https://ccf.georgetown.edu/2020/10/08/childrens-uninsured-rate-rises-by-largest-annual-jump-in-more-than-a-decade-2/#heading-4.
183 “2019 Employer Health Benefits Survey,” Kaiser Family Foundation (September 25, 2019)
https://www.kff.org/health-costs/report/2019-employer-health-benefits-survey/
184 Vistnes, Jessica "Substantial Churn In Health Insurance Offerings By Small Employers, 2014–15" Health Affairs (September 2017).
https://www.healthaffairs.org/doi/abs/10.1377/hlthaff.2017.0431
186 Centers for Medicare and Medicaid Services, “Table 16: National Health Expenditures Amounts and Average Annual Growth From Previous Year Shown By Type of Sponsor,” National Health Expenditure Data (Projected)
https://www.cms.gov/Research-Statistics-Data-and-Systems/Statistics-Trends-and-Reports/NationalHealthExpendData/NationalHealthAccountsProjected
188 Buttle, Rhett, Katie Vlietstra Wonnenberg and Angela Simaan (September 9, 2010), “Small-Business Owners’ Views on Health Coverage and Costs,” The Commonwealth Fund
https://www.commonwealthfund.org/publications/issue-briefs/2019/sep/small-business-owners-views-health-coverage-costs.
190 The Pew Charitable Trusts and the John D. and Catherine T. MacArthur Foundation (August 2014), “State Employee Health Plan Spending: An Examination of Premiums, Cost Drivers, and Policy Approaches,”
https://www.pewtrusts.org/-/media/assets/2014/08/stateemployeehealthcarereportseptemberupdate.pdf.
Cost Burdens and Coverage Gaps in Medicare and Medicaid
Coverage gaps in public insurance programs are entirely unnecessary: they are not the result of imaginary economic laws or actuarial math, but are a political choice. Rather than fully covering the care people need, Congress has decided to prevent Medicare from covering long-term care and medical treatment of people’s eyes, ears, teeth and feet. It has also created expensive copays and deductibles that block seniors and people with disabilities from going to the doctor and filling prescriptions. In Medicaid, Congress and state legislatures have decided not to automatically cover essential care like dental care for everyone, and have weaponized racist, anti-poor, austerity-budget rhetoric to paint people on Medicaid as somehow “undeserving.” This provides them with political cover to perennially underfund Medicaid even as they fully funded health insurance tax deductions for wealthier people, leaving enrollees without enough doctors or medical facilities to treat Medicaid patients. Lawmakers have also decided to exclude most of the U.S. population from both of these programs, including a large majority of people under 65, undocumented residents of all ages and income levels, and newly arrived immigrants and newly disabled people. Yet none of these decisions are permanent: any of these gaps or exclusions could be closed with a single bill.
Portion of Medicare beneficiaries who are underinsured (23.1% nationwide), ranging from 16.0% in DC to 31.7% in West Virginia 191
Portion of orthopedists’ offices that refused to offer an appointment to a Medicaid-insured child with a fracture because of low provider payments and no requirement that doctors treat patients 192
Portion of seniors with no dental coverage 193
Portion of seniors with neither Medicaid nor private long-term care insurance 194
Level to which seniors in most states must spend down their assets in order to qualify for long-term and lower cost-sharing care through Medicaid 195
Portion of Medicare households (including both seniors and younger people with disabilities) who spend more than 20% of their income on medical expenses that aren’t covered by Medicare. 36% of households age 75-84 and 40% of households over age 84 pay more 20% of their income. 64% of all Medicare households pay more than 10% of their income. 196
Percent of seniors who are concerned about being able to pay for basic health care in the next 12 months. 38% are concerned a major medical event could force them into bankruptcy. 197
Portion of seniors who have to pay more for out-of-pocket medical expenses than they have in non-housing assets in the last five years they’re alive. 25% have to pay more than their total assets. 198
age 95 have to pay after they pass their 70th birthday. The 95th percentile has to pay an average of $269,000. 199
191 Schoen, Cathy, Claudia Solís-Román, Nick Huober, and Zachary Kelchner (May 2016), “On Medicare But At Risk: A State-Level Analysis of Beneficiaries Who Are Underinsured or Facing High Total Cost Burdens,” The Commonwealth Fund,
https://www.commonwealthfund.org/publications/issue-briefs/2016/may/medicare-risk-state-level-analysis-beneficiaries-who-are.
192 Iobst, Christopher, Dillon Arango, Dale Segal, and David L. Skaggs (September 2013 ), “National Access to Care for Children with Fractures.” Journal of Pediatric Orthopedics 33, no. 6: 587–91.
https://doi.org/10.1097/BPO.0b013e31829b2da4.
193 Collins, Sara R., Herman K. Bhupal, and Michelle M. Doty (February 2019), “Health Insurance Coverage Eight Years After the ACA: Fewer Uninsured Americans and Shorter Coverage Gaps, but More Underinsured,” Commonwealth Fund,
https://www.commonwealthfund.org/publications/issue-briefs/2019/feb/health-insurance-coverage-eight-years-after-aca.
194 According to the Urban Institute, 11% of people age 65 and up have private long-term care insurance, and according to the Census Bureau, 14% have Medicaid. See Johnson, Richard (August 2, 2016), “Who Is Covered by Private Long-Term Care Insurance?” Urban Institute (August 2, 2016), https://www.urban.org/research/publication/who-covered-private-long-term-care-insurance.; Census Bureau, “Medicaid/Means-Tested Public Coverage by Sex by Age,” 2018 ACS 1-Year Estimates Detailed Tables,
https://data.census.gov/cedsci/table?q=medicaid&tid=ACSDT1Y2018.B27007&hidePreview=false.
195 “Medicaid Eligibility: 2020 Income, Asset & Care Requirements for Nursing Homes & Long-Term Care.” American Council on Aging (April 20, 2020).
https://www.medicaidplanningassistance.org/medicaid-eligibility/
196 Cubanski, Juliette, Kendal Orgera, Anthony Damico, and Tricia Neuman (March 2018), “The Financial Burden of Health Care Spending: Larger for Medicare Households than for Non-Medicare Households,”
https://www.kff.org/medicare/issue-brief/the-financial-burden-of-health-care-spending-larger-for-medicare-households-than-for-non-medicare-households/.
198 Kelley, Amy S., Kathleen McGarry, Sean Fahle, Samuel M. Marshall, Qingling Du, and Jonathan S. Skinner (2010), “Out-of-Pocket Spending in the Last Five Years of Life,” National Bureau of Economic Research Bulletin on Aging and Health, no. 2: 3,
https://www.ncbi.nlm.nih.gov/pmc/articles/PMC3612877/pdf/nihms-313129.pdf.
199 Sudipto Banerjee (April 3, 2018), “Cumulative Out-of-Pocket Health Care Expenses After the Age of 70,”
https://www.ebri.org/health/publications/issue-briefs/content/cumulative-out-of-pocket-health-care-expenses-after-the-age-of-70.