Uninsurance
Roughly 30 million people in the U.S. were uninsured for the entirety of 2019 and 40 million were uninsured at least part of the year. During the pandemic, millions of workers and their families lost insurance coverage when their jobs were cut.
Even in a normal year, millions lose coverage because a routine change in employment, income, marital or family status makes people ineligible to remain on Medicaid or a private insurance plan. More than half a million kids lost insurance coverage from 2016 to 2018 alone, and by blocking Medicaid expansion, politicians in twelve states are denying insurance and denying health care to 4.7 million people.
Of course, health coverage is no guarantee of health care: as our report on underinsurance shows, insurance companies use copays, deductibles, benefit limitations and narrow provider networks to prevent people with insurance from getting care, and by building coverage gaps into Medicare, underfunding Medicaid, and propping up a patchwork insurance system, Congress has done the same. A just health care system leaves no one—not a single person—uninsured.
How Many People Are Uninsured?
It Depends Who You Count…
Most surveys count people as insured if they have partial coverage at the time they take the survey, but millions of people thus categorized as “insured” find themselves uninsured during the course of each year or are left out of these statistics altogether.
Total number of people uninsured at some point during the course of a typical year 1
Additional number of people who lost insurance in the spring of 2020 because their insurance was tied to a job they lost to COVID-19 2
Projected people who will be uninsured in 2021, up from previous estimates due to COVID-19 4
Percent of adults (19-64) who are completely uninsured at a single point in time in a typical year, depending on the survey methodology 5
Percent of people with a gap in insurance coverage each year, depending on the survey methodology 6
Number of people who experience a gap in coverage each year 7
Projected no. of people uninsured (at one point in time) by 2028 if current policies continue 8
Number of people exclude from Census counts of the uninsured because they are institutionalized in prisons, nursing homes, mental health hospitals, or another facility, 2018 9
Number of states in which more than 10% of the population was uninsured in 2017 10
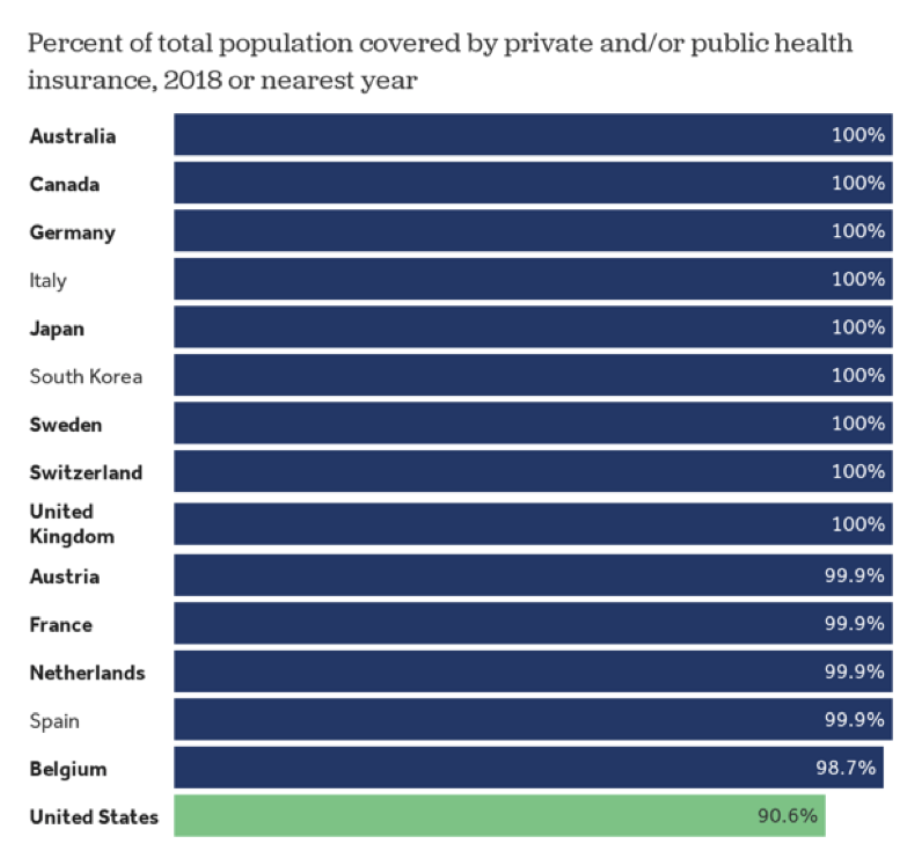
Uninsurance rate in Australia, Canada, the Czech Republic, Denmark, Finland, Greece, Iceland, Ireland, Israel, Italy, South Korea, Latvia, New Zealand, Norway, Portugal, Slovenia, Spain, Sweden, Switzerland, and the United Kingdom 11
…and What You Define as "Insured"
Most surveys consider people “insured” even if only some of their body parts, medical needs, and medical providers are covered, and even if cost barriers and administrative barriers prevent them from ever getting care.
Portion of people with no dental coverage 13
Portion of seniors with no dental coverage 14
Number of states that provide no Medicaid coverage for hearing aids 15
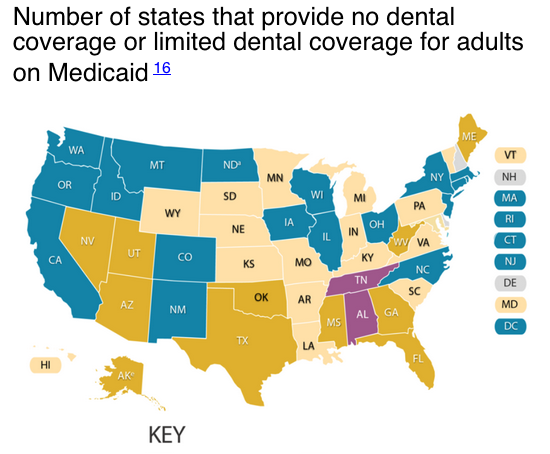
Number of states that provide no dental coverage or limited dental coverage for adults on Medicaid 16
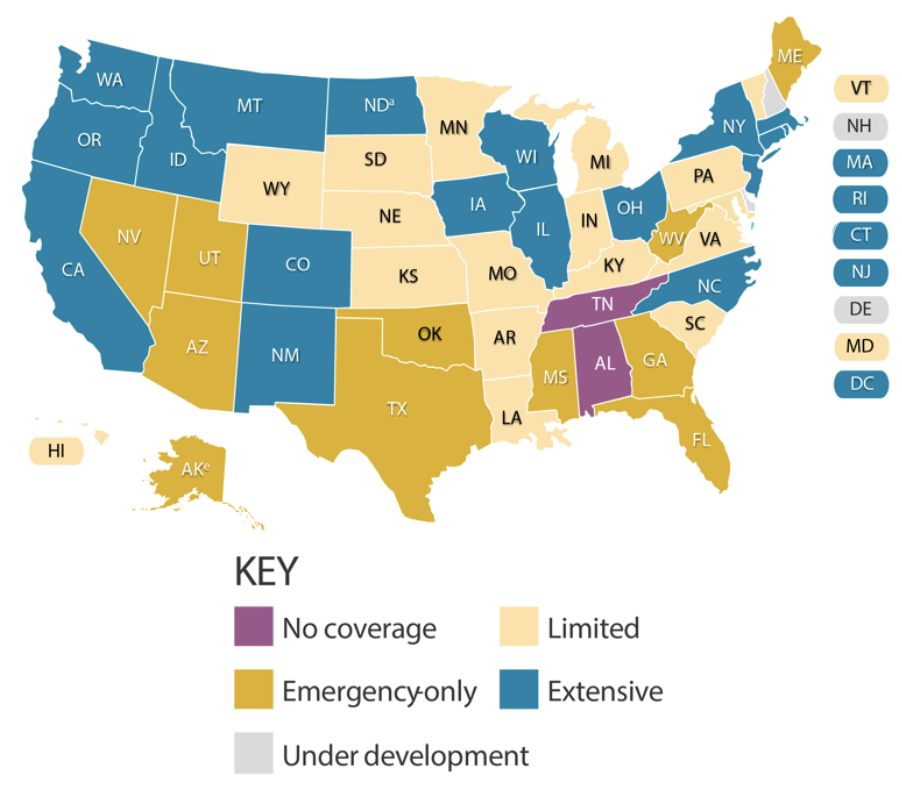 Source: Center for Health Care Strategies
Portion of seniors with no long-term care insurance 17
Percent of seniors with no Medicaid 18
Portion of people who will develop a disability in their later years and need long-term services and supports 19
Portion of people 65-69 applying for long-term care insurance who are denied coverage by insurance companies. 52% of people over 75 are denied coverage 20
Percent of employers offering long-term care insurance to employees 21
Portion of ACA marketplace plans that limit coverage of providers through narrow networks 22
1 38,125,200 according to the Census Bureau and 43,800,000 according to The Commonwealth Fund. 38.1252 million = 27.426 million + (1 – 96.4%) x 296.2 million. See Berchick, Edward (November 2019), “Health Insurance Coverage in the United States: 2018,” U.S. Census Bureau, p. 3-5, https://www.census.gov/content/dam/Census/library/publications/2019/demo/p60-267.pdf.; Collins, Sara R., Herman K. Bhupal and Michelle M. Doty (February 2019), “Health Insurance Coverage Eight Years After the ACA: Fewer Uninsured Americans and Shorter Coverage Gaps, But More Underinsured,” The Commonwealth Fund, p. 23,
https://www.commonwealthfund.org/sites/default/files/2019- 02/Collins_hlt_ins_coverage_8_years_after_ACA_2018_biennial_survey_sb.pdf.
2 Garfield, Rachel “Eligibility for ACA Health Coverage Following Job Loss” Kaiser Family Foundation (May 13 , 2020). https://www.kff.org/coronavirus-covid-19/issue-brief/eligibility-for-aca-health-coverage-following-job-loss/. For comparative estimates of workers losing coverage (not counting dependents), see Economic Policy Institute:
https://www.epi.org/blog/16-2- million-workers-have-likely-lost-employer-provided-health-insurance-since-the-coronavirus-shock-began/.
3 The number of people uninsured all year long in 2017 or 2018 was 28.6 million according to The Census Bureau, 28.9 million according to Kaiser Family Foundation, 30.1 million according to Urban Institute, 30.4 million according to The Commonwealth Fund and 30.7 million according to the Centers for Medicare & Medicaid Services. See Census Bureau, “Table S2701: Selected Characteristics of Health Insurance Coverage in the United States,” 2018 American Community Survey, https://data.census.gov/cedsci/table?q=insurance&tid=ACSST1Y2018.S2701&hidePreview=false.; Tolbert, Jennifer, Kendal Orgera & Anthony Damico (December 13, 2019), “Key Facts about the Uninsured Population,” Kaiser Family Foundation, https://www.kff.org/uninsured/issue-brief/key-facts-about-the-uninsured-population/.; Blumberg, Linda (July 2018), “Characteristics of the Remaining Uninsured: An Update,” Urban Institute, https://www.urban.org/sites/default/files/publication/98764/2001914-characteristics-of-the-remaining-uninsured-an-update_2.pdf.; Gunja, Munira Z. & Sara R. Collins (Aug. 28, 2019), “Who Are the Remaining Uninsured, and Why Do They Lack Coverage? Findings from the Commonwealth Fund Biennial Health Insurance Survey, 2018,” Commonwealth Fund, https://www.commonwealthfund.org/publications/issue-briefs/2019/aug/who-are-remaining-uninsured-and-why-do-they-lack- coverage. CMS: “Table 22: Health Insurance Enrollment and Uninsured; Number of Enrollees and Annual Percent Change, Calendar Years 1987- 2018”
https://www.cms.gov/Research-Statistics-Data-and-Systems/Statistics-Trends-and- Reports/NationalHealthExpendData/NationalHealthAccountsHistorical.
4 Congressional Budget Office (September 2020), “Federal Subsidies for Health Insurance Coverage for People Under 65: 2020 to 2030,”
https://www.cbo.gov/publication/56650.
5 For a comparison of rates from the Current Population Survey, Commonwealth Fund Affordable Care Act Tracking Survey, Commonwealth Fund Biennial Health Insurance Survey, Gallup Healthways Well-Being Index, National Health Interview Survey, and Urban Institute Health Reform Monitoring Survey, see Collins et al. (February 2019), footnote 1.; Also see Tolbert et al. (December 13, 2019), footnote 3.
6 3.9% according to the Census Bureau, 10% according to the Commonwealth Fund, and 12.9% according to the Centers for Disease Control and Prevention. See Berchick (November 2019), footnote 1; Collins (February 2019), footnote 1; and Okoro, Catherine (February 24, 2017), “Surveillance for Health Care Access and Health Services Use, Adults Aged 18-64 Years – Behavioral Risk Factor Surveillance System, United States, 2014,” Centers for Disease Control and Prevention,
https://www.cdc.gov/mmwr/volumes/66/ss/ss6607a1.htm.
7 The Census Bureau reports that at least 3.6% of the 296.2 million people who were covered at least part of the year experienced a gap in coverage 2018, The Commonwealth Fund reports that 19.3 million did and the CDC reports that 10,860,000 people under 65 did. See Berchick (November 2019), footnote 1; Collins et al. (February 2019), footnote 1; and Centers for Disease Control and Prevention (2019), “Table P-12b. Frequency distribution (number in thousands) of any period without health insurance coverage during the past 12 months,” 2018 National Health Interview Survey,
https://ftp.cdc.gov/pub/Health_Statistics/NCHS/NHIS/SHS/2018_SHS_Table_P-12.pdf.
8 Centers for Medicare and Medicaid Services (2019), “Table 17,” National Health Expenditure Projections 2019-2028,
https://www.cms.gov/Research-Statistics-Data-and-Systems/Statistics-Trends-and- Reports/NationalHealthExpendData/NationalHealthAccountsProjected?utm_source=link_newsv9&utm_campaign=item_248741&u tm_medium=copy
9 Calculation based on American Community Survey data from the U.S. Census Bureau, total U.S. population (Table DP05) and U.S. civilian noninstitutionalized population (Table S2701),
https://data.census.gov/cedsci/table?q=population&tid=ACSDP1Y2018.DP05&hidePreview=false
10 Aron-Dine, Aviva (Mar. 21, 2019), “Improving ACA Subsidies for Low- and Moderate-Income Consumers Is Key to Increasing Coverage,” Center on Budget and Policy Priority Policies,
https://www.cbpp.org/research/health/improving-aca-subsidies-for-low- and-moderate-income-consumers-is-key-to-increasing
11 Organization for Economic Co-Operation and Development (September 11, 2020), “Health Expenditure and Financing,”
https://stats.oecd.org/Index.aspx?DataSetCode=SHA#
12 Peterson Center on Healthcare & Kaiser Family Foundation, “Percent insured,” Peterson-KFF Health Tracker,
https://www.healthsystemtracker.org/indicator/access-affordability/percent-insured/
13 Manski, Richard (Nov. 2017), “Dental Services: Use, Expenses, Source of Payment, Coverage and Procedure Type, 1996-2015.” Agency for Healthcare Research and Quality
https://meps.ahrq.gov/data_files/publications/rf38/rf38.shtml
15 Arnold, Michelle (Aug. 2017), “Medicaid Hearing Aid Coverage For Older Adult Beneficiaries: A State-By-State Comparison,”
Health Affairs,
https://www.healthaffairs.org/doi/full/10.1377/hlthaff.2016.1610
16 Center for Health Care Strategies (September 2019), “Medicaid Adult Dental Benefits: An Overview,”
https://www.chcs.org/media/Adult-Oral-Health-Fact-Sheet_091519.pdf
17 Johnson, Richard W. (August 2, 2016 ), “Who Is Covered by Private Long-Term Care Insurance?” Urban Institute,
https://www.urban.org/research/publication/who-covered-private-long-term-care-insurance
18 (1,616,506 + 1,146,786) / (14,089,530 + 8,730,280) = 12.1%. See Census Bureau, “Medicaid/Means-Tested Public Coverage by Sex by Age,” 2018 ACS 1-Year Estimates Detailed Tables,
https://data.census.gov/cedsci/table?q=medicaid&tid=ACSDT1Y2018.B27007&hidePreview=false.
19 Nguyen, Vivian (March 2017), “Long-Term Support and Services,” AARP Public Policy Institute,
https://www.aarp.org/content/dam/aarp/ppi/2017-01/Fact%20Sheet%20Long-Term%20Support%20and%20Services.pdf
20 American Association of Long-Term Care Insurance (December 2019), “Long-Term Care Insurance Facts – Data – Statistics – 2019 Report,”
https://www.aaltci.org/long-term-care-insurance/learning-center/ltcfacts-2019.php#2019declines.
21 Nordman, Eric (May 2016), “The State of Long-Term Care Insurance: The Market, Challenges and Future Innovations,” National Association of Insurance Commissioners & The Center for Insurance Policy and Research,
https://www.naic.org/documents/cipr_current_study_160519_ltc_insurance.pdf
22 Singhal, Shubham (May 2017 ), “Atomization of the network: How far will it go?” McKinsey and Company,
https://healthcare.mckinsey.com/atomization-network-how-far-will-it-go/
Why Are People Uninsured?
The U.S. insurance system is fractured between multiple public and private insurance plans, letting millions of people fall through the cracks. Cost barriers, changes in job- and income-based insurance eligibility, discrimination against undocumented immigrants, people with disabilities and people with legal records, state leaders’ decisions to block Medicaid expansion, and onerous eligibility and bureaucratic requirements all keep people uninsured.
Overview
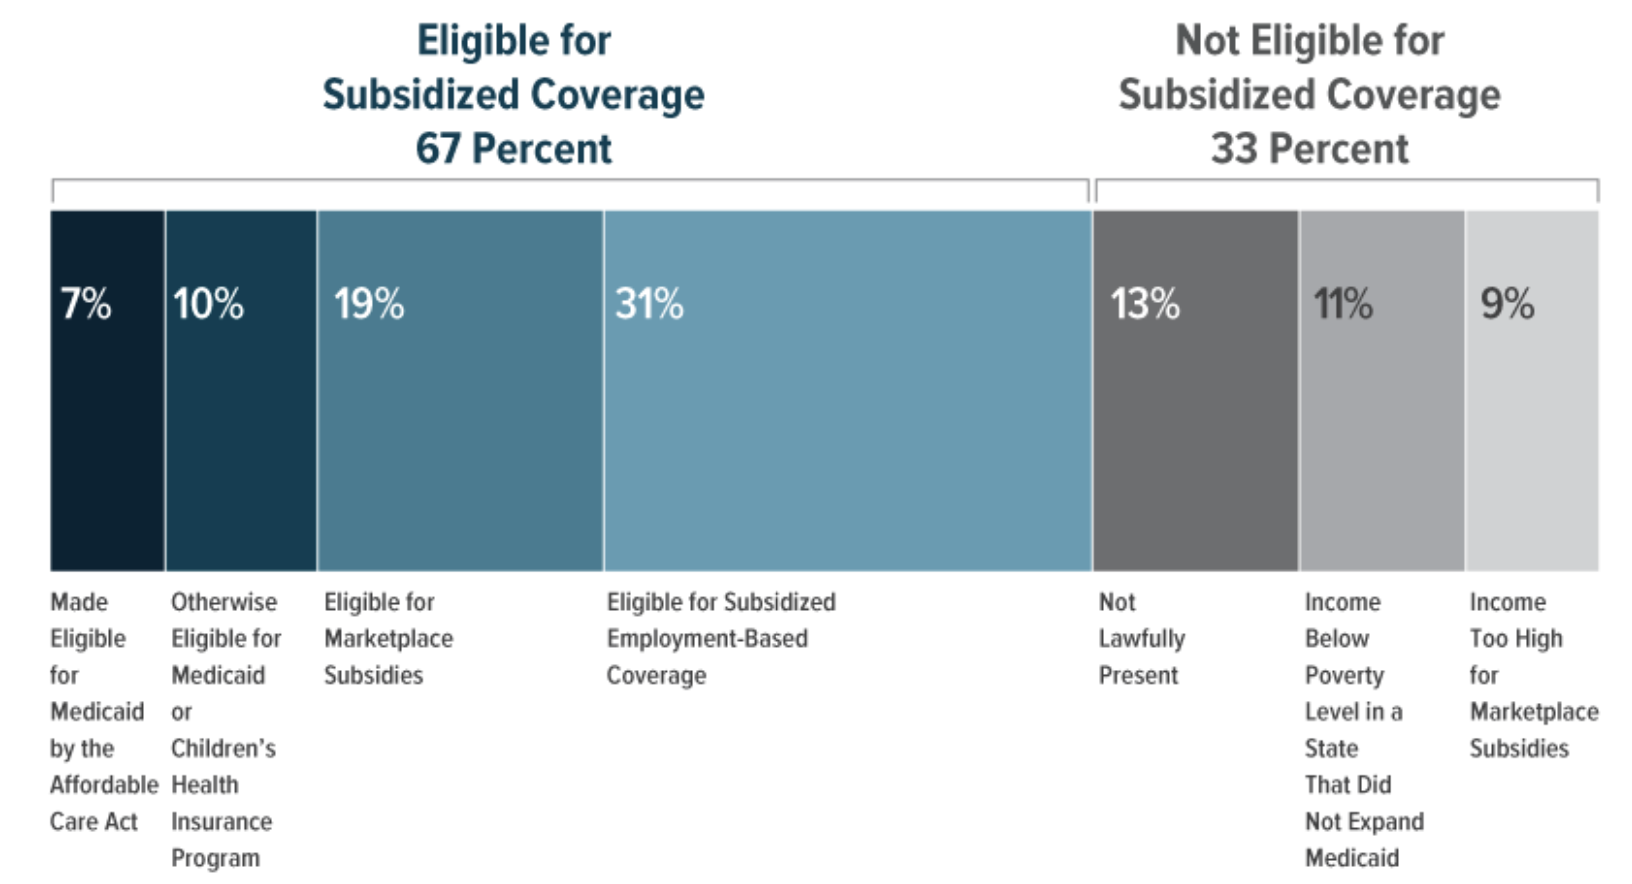
Overall, one-third of the 29.8 million people who were uninsured for all of 2019 were legally prohibited from receiving Medicaid, Medicare or insurance subsidies. Two-thirds were legally eligible, but prices, bureaucratic requirements or other barriers kept them uninsured.
Legal Exclusion from Medicaid, Medicare and Public Subsidies
Federal and state law discriminatorily excludes whole classes of people from public insurance programs and insurance subsidies. Undocumented immigrants are explicitly written out of the Affordable Care Act, Medicaid, Medicare and other federal and state policies. Recent documented immigrants and people with new disabilities face years- long waiting periods for Medicaid and Medicare. People who have been incarcerated face hiring discrimination that excludes them from job-based insurance. California has demonstrated that states, counties and cities can take action to cover people when federal law fails them, but few states and localities have taken action so far.
Number people uninsured because undocumented immigrants are denied public insurance and health insurance subsidies 24
Number of people with disabilities who are uninsured 26
Percent of previously incarcerated men who are entirely uninsured 27
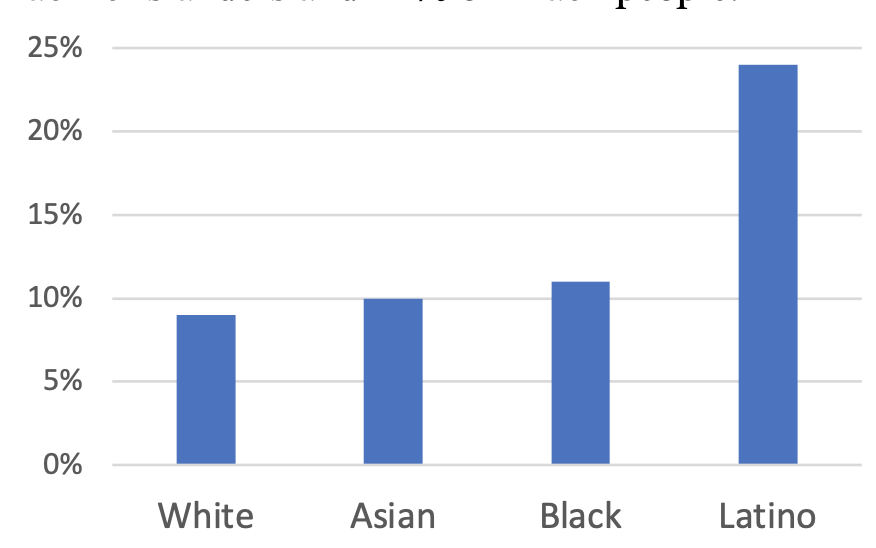
Unemployment rate for formerly incarcerated Black women and men in 2018 28
Unemployment rate for formerly incarcerated White women and men in 2018 29
Unemployment rate for the general U.S. population in 2018 30
Percent of formerly incarcerated Black, Latina and White women, respectively, who were employed, but in part-time or occasional jobs—jobs that almost never provide health insurance—in 2018. Among formerly incarcerated Black, Latino, and White men with employment, 23%, 20% and 14% were in part-time or occasional jobs 31
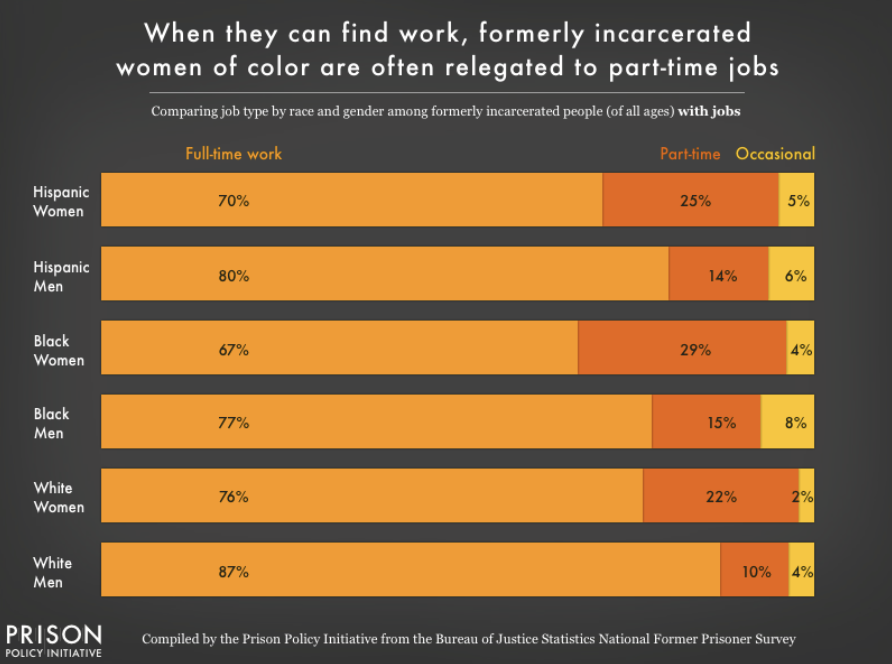 Source: Prison Policy Initiative
Estimated undocumented children and young adults enrolled in Medicaid through California’s expansion 32
Number of states that have followed California in expanding Medicaid to undocumented young adults 33
Percent of uninsured San Francisco residents (including undocumented residents) who gained coverage through the city’s publicly financed health care program 34
Prohibitive Cost Barriers
Number of people who are eligible for insurance but cannot afford it 35
Portion of adults who cannot afford an unexpected expense of $400 36
Percent of currently employed workers who have no insurance 37
Uninsured workers who do not accept employer- sponsored coverage report cost as the main reason for declining 38
Average annual worker premiums for an employer- based insurance plan 39
Average annual deductible on a high-deductible family plan 40
Out-of-pocket maximums for individuals and families, respectively, under the Affordable Care Act 41
Out-of-pocket maximum allowed by the ACA for a family plan in 2020 42
Precarity of Insurance Tied to Jobs
People frequently change jobs and experience shifts in income. Tying people’s health insurance to jobs thus leads to people lose insurance coverage all the time. This is especially true for low-income workers, whose jobs are precarious and whose hours and income are highly variable. In addition, women are more likely to hold part-time or occasional jobs, work in service sectors, or do unpaid caregiving—all forms of essential work that rarely come with health insurance benefits. Women of color, not surprisingly, are disproportionately affected.

Percentage of people with poverty-level incomes who find themselves uninsured at some point each year 44
Portion of low-income people experiencing a gap in coverage who could not get needed medical care in the past year because of the cost 45
Percent of uninsured nonelderly adults who said they were uninsured because the person who carried the health coverage in their family lost their job or changed employers 46
Uninsured workers were uninsured because of a marital status change, the death of a spouse or parent, or loss of eligibility due to age or leaving school 47
Rate at which women choose to work part-time jobs compared to men (largely because women tend to carry more family caregiving responsibilities) 48
Percentage of non-citizen, Latina, Black, and White women under 65, respectively, who have employer- based insurance 49
Probability of White, Asian, Latinx, and Black people losing insurance coverage within a year 50
Higher likelihood that women are insured under someone else’s (usually a spouse’s) name compared to men. This deprives millions of women autonomy by pushing them into double dependency on employers and on men. 51
For more on coverage gaps as people move in and out of insurance eligibility, see our Losing Insurance Coverage fact sheet at https://dignityandrights.org/HealthStatistics.
Exclusionary Bureaucratic Barriers
Medicaid and workers’ compensations are supposed to cover medical care for people with low incomes and people with work-related injuries, illnesses and disabilities, but people who rely on these programs face a battery of bureaucratic barriers like so- called “work requirements” that are specifically designed to save money by disqualifying and disenrolling people so that they cannot receive care.
Number of people who are eligible for Medicaid or CHIP but are unenrolled 52
Number of people in Arkansas who were pushed out of Medicaid in 2018 by the state’s so-called “work requirement,” a bureaucratic maneuver designed to deny people eligibility 53
Number of people who would have been pushed out of Medicaid in Michigan and New Hampshire, respectively, had state lawmakers enacted exclusionary paperwork requirements 54
Percent of adults 19-64 on Medicaid who are working full or part time. The vast majority of people not employed are not working for a reason 55
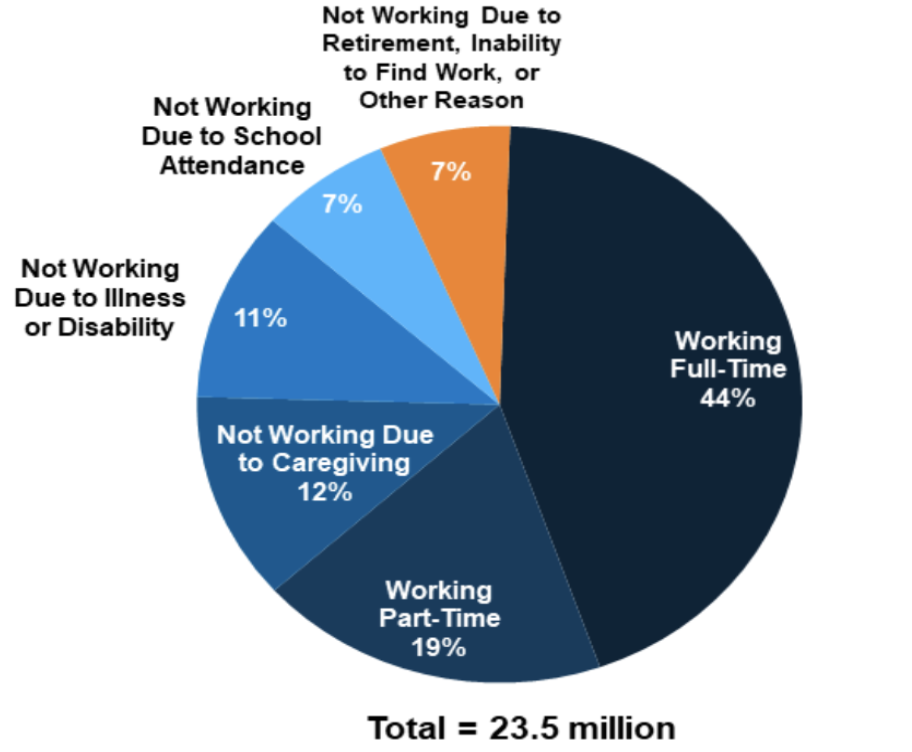 Source: Kaiser Family Foundation
Percent of people subject to Medicaid work- reporting requirements who have at least one worker in their family 56
County unemployment rate above which Michigan lawmakers would have exempted people from repeatedly filling out burdensome employment-and- job-hunting forms to remain eligible for Medicaid. Had the courts not blocked Michigan’s plan, this racially motivated policy would have exempted people in majority-white counties from this bureaucratic burden while forcing people in counties with more Black, Latinx, Arab, and other people of color to fill out forms and be disenrolled 57
Increase in workers’ compensation claims denied by insurance companies and employers from 2013-2017. Workers with long-term muskuloskeletal injuries or chronic illnesses caused by toxic exposure are disproportionately denied. 58
Percent of workers with occupational illnesses who never file a workers’ comp claim to receive medical care or disability payments for their illness 59
Percent of the cost of worker injuries that is actually covered by workers’ compensation insurance, which is supposed to cover the cost of all such injuries. 16% of costs are shifted onto the government, 13% onto private health insurance, and 50% onto workers and their families 60
Exclusionary Income and Asset Tests for Medicaid
By separating and sorting people according to imagined notions of deservingness, Medicaid, like all means-tested programs, defines eligibility according to arbitrary limits that let many people fall through the cracks as their incomes change over time. Eligibility is especially stringent in the twelve states that have refused to expand Medicaid. And all over the country, seniors and people with disabilities are forced to spend themselves into poverty in order to qualify for long-term care.
Annual income above which parents in Alabama become ineligible for Medicaid (slightly more for families with 3+ people) 61
Number of states in which annual income limits for parents to qualify for Medicaid are less than $10,000 62
Level to which seniors in most states must spend down their assets in order to qualify for long-term care and lower cost-sharing through Medicaid 63
Percent of uninsured nonelderly adults who lost Medicaid because a new job, an increase in income or no longer being pregnant made them ineligible according to their state’s rules 64
State Lawmakers’ Refusal to Expand Medicaid
Governors and legislators in twelve states have refused to expand Medicaid to people with incomes above the poverty line, a decision that has left millions of people uninsured and unable to get care. Medicaid expansion gets people the health care they need, saves lives, saves states money, and is an overwhelmingly popular policy among voters, but these lawmakers refuse to budge, choosing to weaponize racist, classist, and sexist stigma against people on Medicaid for their own political gain rather than meeting the needs of their constituents.
Number of people left uninsured by state governments that, as of June 2020, refused to expand Medicaid. This was up 1.9 million because as people’s jobs were cut due to COVID-19, so was their employer-based insurance 65
Number of states in which political leaders have refused to expand Medicaid 66
Portion of the up-front cost of Medicaid expansion paid by the federal government 67
Percent reduction range in state spending on traditional Medicaid associated with Medicaid expansion 68
States’ savings on mental health care, corrections and uncompensated care after Medicaid expansion 69
Number of jobs created for every $100,000 increase in public spending on Medicaid 70
As of 2020, the number of states in which the public has expanded Medicaid through a ballot initiative, overruling intransigent public officials. These states were Idaho, Maine, Missouri, Nebraska, Oklahoma, and Utah 71
Reduction in evictions, bankruptcies, wage garnishments, and similar legal and financial burdens for people who enrolled in Medicaid through Michigan’s Medicaid expansion 72
Reduction in the number of people with catastrophic medical expenditures achieved through Oregon’s 2008 Medicaid expansion. In addition, 57% fewer people ended up with medical debt and 24% fewer had to borrow money to pay bills or skip bill payments 73
23 Congressional Budget Office (September 2020), “Who Went Without Health Insurance in 2019, and Why?,” p. 1,
https://www.cbo.gov/publication/56504.
27 Winkelman, Tyler N. A., HwaJung Choi, and Matthew M. Davis (May 2017), “The Affordable Care Act, Insurance Coverage, and Health Care Utilization of Previously Incarcerated Young Men: 2008–2015,” American Journal of Public Health 107, no. 5: 807-11.
https://doi.org/10.2105/AJPH.2017.303703.
28 Couloute, Lucius and Daniel Kopf (July 2018), “Out of Prison & Out of Work: Unemployment among formerly incarcerated people,” Prison Policy Initiative.
https://www.prisonpolicy.org/reports/outofwork.html.
32 As of February 2018, 127,845 undocumented California children 18 and under were enrolled in Medicaid, and Governor Gavin Newsom estimated 138,000 residents 19-25 would enroll through a new expansion to undocumented young adults. See Ibarra, Ana (July 9, 2019 ), “Medi-Cal Enrollment Among Immigrant Kids Stalls, Then Falls. Is Fear to Blame?” Kaiser Health News, https://khn.org/news/medi-cal-enrollment-among-immigrant-kids-stalls-then-falls-is-fear-to-blame/ and Newsom, Gavin (January 9, 2019), “Governor’s Budget Summary 2019-2020,” State of California.
http://www.ebudget.ca.gov/2019- 20/pdf/BudgetSummary/FullBudgetSummary.pdf.
33 Artiga, Samantha (July 15, 2019), “Health Coverage and Care of Undocumented Immigrants,” Kaiser Family Foundation.
https://www.kff.org/disparities-policy/issue-brief/health-coverage-and-care-of-undocumented-immigrants/
34 Katz, Mitchell (Feb. 2011), “Transforming a Traditional Safety Net into a Coordinated Care System: Lessons from Healthy San Francisco,” Health Affairs.
https://www.healthaffairs.org/doi/full/10.1377/hlthaff.2010.0003
36 McCarthy-Alfano, Megan (April 2 2019), "Measuring the Burden of Health Care Costs for Working Families," Health Affairs.
https://www.healthaffairs.org/do/10.1377/hblog20190327.999531/full/
37 U.S. Census Bureau, 2019 American Community Survey (ACS).
https://data.census.gov/cedsci/table?q=ACSDT1Y2019.B27011&tid=ACSDT1Y2019.B27011&hidePreview=true
38 Tolbert, Jennifer, Kendal Orgera and Anthony Damico (November 6, 2020), “Key Facts about the Uninsured Population,” Kaiser Family Foundation.
https://www.kff.org/uninsured/issue-brief/key-facts-about-the-uninsured-population/.
39 Claxton, Gary (Sep. 2019), “Employer Health Benefits,” Kaiser Family Foundation.
http://files.kff.org/attachment/Report- Employer-Health-Benefits-Annual-Survey-2019
41 Centers for Medicare & Medicaid Services (2020), “Out-of-pocket maximum/limit,” Healthcare.gov.
https://www.healthcare.gov/glossary/out-of-pocket-maximum-limit
43 Graves, John. “The Evolving Dynamics of Employer‐Sponsored Health Insurance: Implications for Workers, Employers, and the the Affordable Care Act”. The Milbank Quarterly (December 19 , 2016).
https://onlinelibrary.wiley.com/doi/abs/10.1111/1468- 0009.12229
48 19.9% of women voluntarily work part time versus 9.1% of men. See U.S. Bureau of Labor Statistics (March 2018), “Who chooses
part-time work and why?,”
https://www.bls.gov/opub/mlr/2018/article/who-chooses-part-time-work-and-why.htm.
49 Kaiser Family Foundation (January 24, 2020), “Women’s Health Insurance Coverage,”
https://www.kff.org/womens-health- policy/fact-sheet/womens-health-insurance-coverage-fact-sheet/.
50 Note that this study, published in 2017, uses data from 2008-2012 before the Affordable Care Act went into effect. It is possible that
the Act (especially Medicaid expansion) has increased coverage stability to some degree, but insurance coverage nevertheless remains highly volatile for people as they lose and change jobs and move in and out of eligibility for Medicaid and ACA subsidies as they experience changes in income, state of residence, births, dependents, age, marital status, etc. See Sohn, Heeju (rev. April 2017), “Racial and Ethnic Disparities in Health Insurance Coverage: Dynamics of Gaining and Losing Coverage over the Life- Course,” Population Research and Policy Review 36, no. 2: 181–201.
https://doi.org/10.1007/s11113-016-9416-y.
51 17% of men and 44.6% of women were insured under someone else’s name in 2003. 66.8% of men and 36.8% of women were insured under their own name. Sohn, Heeju (August 2015), “Health Insurance and Risk of Divorce: Does Having Your Own Insurance Matter?” Journal of Marriage and the Family 77, no. 4: 982–95.
https://doi.org/10.1111/jomf.12195.
53 According to the Arkansas Department of Human Services, as reported by Wagner, Jennifer and Jessica Schubel (November 18, 2020), “States’ Experiences Confirm Harmful Effects of Medicaid Work Requirements,” Center on Budget and Policy Priorities,
https://www.cbpp.org/health/states-experiences-confirm-harmful-effects-of-medicaid-work-requirements.
55 Garfield, Rachel, Robin Rudowitz, Kendal Orgera and Anthony Damico (August 8, 2019), “Understanding the Intersection of Medicaid and Work: What Does the Data Say?”
https://www.kff.org/medicaid/issue-brief/understanding-the-intersection-of- medicaid-and-work-what-does-the-data-say/.
56 Katch, Hannah, Jennifer Wagner and Aviva Aron-Dine (August 13, 2018), “Taking Medicaid Coverage Away From People Not Meeting Work Requirements Will Reduce Low-Income Families’ Access to Care and Worsen Health Outcomes,” Center on Budget and Policy Priorities, https://www.cbpp.org/research/health/taking-medicaid-coverage-away-from-people-not-meeting-work- requirements-will-reduce
https://www.cbpp.org/research/health/taking-medicaid-coverage-away-from-people-not-meeting-work- requirements-will-reduce.
57 Scott, Dylan (May 3, 2018), “How Medicaid work requirements can exempt rural whites but not urban blacks,” Vox,
https://www.vox.com/policy-and-politics/2018/5/3/17315382/medicaid-work-requirements-michigan-race.
58 See Kelly Flannery, Hallie Cooley, Christopher Geldes, and Kelly Billings (May 2018), “Claims Denied,” Lockton Companies,
https://www.lockton.com/whitepapers/Flannery_Cooley_Geldes_Billings-Workers_Compensation-May18-LR.pdf.
59 Biddle, J., K. Roberts, K. D. Rosenman, and E. M. Welch (April 1998), “What Percentage of Workers with Work-Related Illnesses Receive Workers’ Compensation Benefits?” Journal of Occupational and Environmental Medicine 40, no. 4: 325–31.
https://doi.org/10.1097/00043764-199804000-00006.
60 Occupational Safety & Health Administration (2015), “Adding Inequality to Injury: The Costs of Failing to Protect Workers on the Job,”
https://www.osha.gov/Publications/inequality_michaels_june2015.pdf.
61 Calculations based on income limits from Medicaid.gov and the 2020 federal poverty line for a family of two. See Centers for Medicare & Medicaid Services, “Medicaid, Children’s Health Insurance Program, & Basic Health Program Eligibility Levels.” Medicaid.gov, https://www.medicaid.gov/medicaid/national-medicaid-chip-program-information/medicaid-childrens-health- insurance-program-basic-health-program-eligibility-levels/index.html#footnote9.; Office of the Assistant Secretary for Planning and Evaluation (January 8, 2020), “Poverty Guidelines,” U.S. Department of Health and Human Services,
https://aspe.hhs.gov/poverty- guidelines.
63 American Council on Aging (April 20, 2020), “Medicaid Eligibility: 2020 Income, Asset & Care Requirements for Nursing Homes & Long-Term Care,”
https://www.medicaidplanningassistance.org/medicaid-eligibility/
65 Singh, Rakesh (June 25, 2020), “4.7 Million Uninsured Adults Could Become Eligible for Medicaid by 2021 if All Remaining States Expanded the Program under the ACA,” Kaiser Family Foundation,
https://www.kff.org/uninsured/press-release/4-7-million- uninsured-adults-could-become-eligible-for-medicaid-by-2021-if-all-remaining-states-expanded-the-program-under-the-aca/
66 Kaiser Family Foundation (November 2, 2020), “Status of State Medicaid Expansion Decisions: Interactive Map,”
https://www.kff.org/medicaid/issue-brief/status-of-state-medicaid-expansion-decisions-interactive-map/
67 Hayes, Susan (Feb. 15, 2019), “The Fiscal Case for Medicaid Expansion,” The Commonwealth Fund,
https://www.commonwealthfund.org/blog/2019/fiscal-case-medicaid- expansion#:~:text=The%20Federal%20Government%20Pays%2090,year%20for%20a%20single%20person.
68 Ward, Bryce (May 5, 2020), “The Impact of Medicaid Expansion on States’ Budgets,” The Commonwealth Fund,
https://www.commonwealthfund.org/publications/issue-briefs/2020/may/impact-medicaid-expansion-states-budgets
70 Chodorow-Reich, Gabriel (August 2012), “Does State Fiscal Relief during Recessions Increase Employment? Evidence from the American Recovery and Reinvestment Act,” American Economic Association,
https://www.aeaweb.org/articles?id=10.1257/pol.4.3.118.
71 Norris, Louise (November 10, 2020), “Find Medicaid coverage in your state,” HealthInsurance.org, =
https://www.healthinsurance.org/medicaid/.
72 Miller, Sarah, Luojia Hu, Robert Kaestner, Bhashkar Mazumder, and Ashley Wong (September 2018), “The ACA Medicaid Expansion in Michigan and Financial Health.” Cambridge, MA: National Bureau of Economic Research,
https://doi.org/10.3386/w25053.
73 Baicker, Katherine, Sarah L. Taubman, Heidi L. Allen, Mira Bernstein, Jonathan H. Gruber, Joseph P. Newhouse, Eric C. Schneider, Bill J. Wright, Alan M. Zaslavsky, and Amy N. Finkelstein (May 2, 2013), “The Oregon Experiment — Effects of Medicaid on Clinical Outcomes,” The New England Journal of Medicine 368, no. 18: 1713–22.
https://doi.org/10.1056/NEJMsa1212321.
Essential Workers and Families Left Behind by Employer-Based Insurance
Tying health insurance to jobs makes all workers vulnerable to losing insurance if they leave or lose a job, but especially hurts the tens of millions of people who are left out of employer-based insurance completely. Millions of low-wage workers, workers in part- time or seasonal jobs, employees of small businesses, workers in informal sectors, and these workers’ families are denied insurance and thus denied health care. Employer- based insurance also leaves out people who can’t work, whether because they’re in school, caring for a child or adult, or are dealing with an illness or disability. All this hurts our public health and makes all workers and families vulnerable to losing insurance coverage. It especially hurts immigrants, people of color, and women, who are the people who most often work in these essential jobs and take on these added responsibilities.
Most Uninsured Families Are Working
Percent of uninsured people under 65 who are in working families. 73.2% of uninsured families have a full-time worker and 11.5% have a part-time worker. Just 15.4% have no formal employment. 74
Percent of nonelderly uninsured workers who work for an employer that does not offer health benefits 75
Essential Workers Are Often Uninsured
Essential workers perform essential services for society, but are very often paid low wages and denied health insurance. Women, immigrants, people of color, or small business employees are especially likely to work essential jobs yet be uninsured.
Number of essential workers in just six key work roles who were uninsured in 2018 76
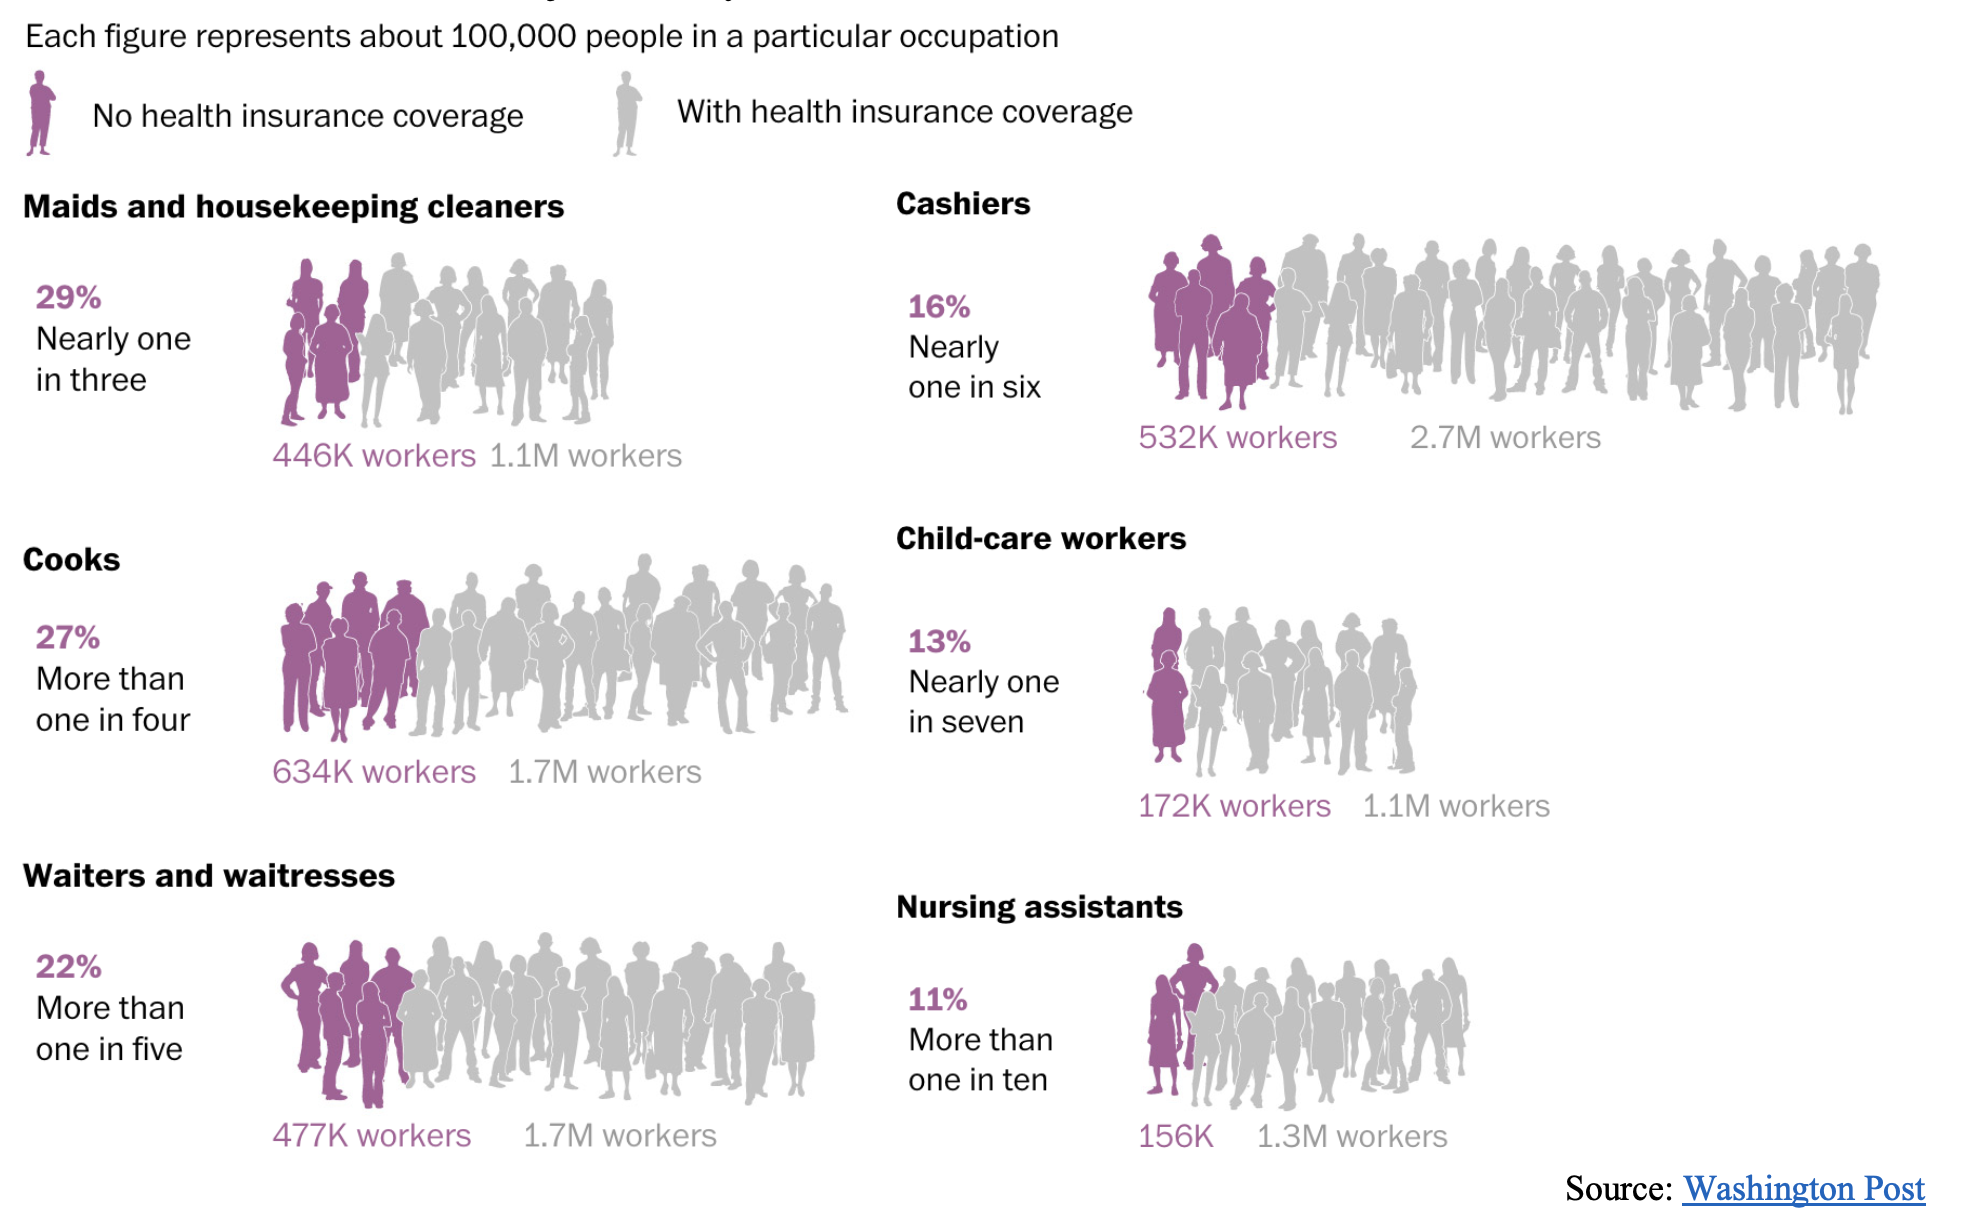 Source: Washington Post
Portion of farmworkers who are uninsured 77
Percent of building cleaning service workers without insurance, over 60% of whom are people of color and over 40% of whom are immigrants. 78
Percent of child care workers without insurance. 95% of workers are women and 45% are of color. 79
Percent of grocery workers without insurance 80
Percent of trucking, warehouse, and postal service workers without insurance 81
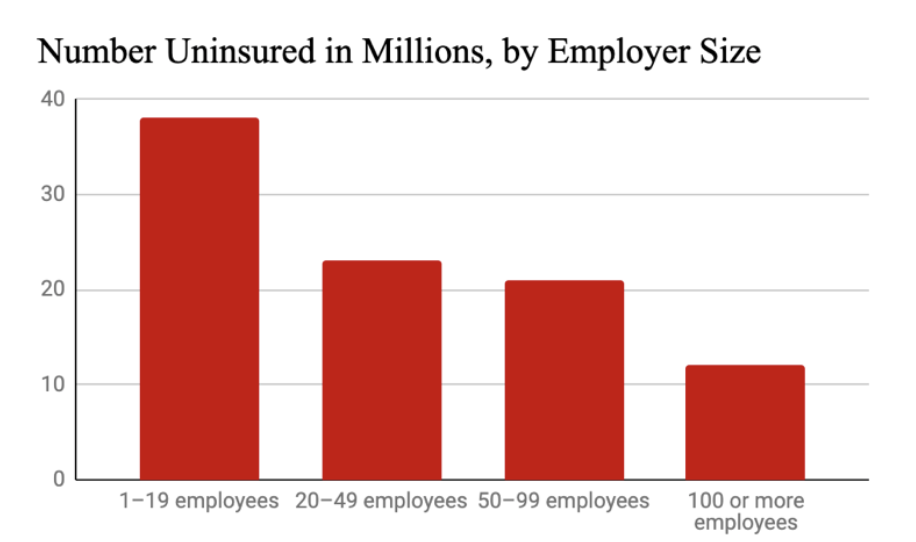
Portion of small-business employees who are entirely uninsured 82
Percentage of private-sector employers with fifty or fewer workers who offered insurance in 2014 but not in 2015 83
Percent of home health aides and nursing assistants in nursing homes, respectively, who are uninsured. Home care workers are paid just $17,500 a year on average, and residential care aids just $21,100 84
Percent of licensed practical nurses in nursing homes and home care who are uninsured (12%) compared with registered nurses (5%) 85
Percent of all nursing home staff who are uninsured 86
Percent of hospital workers who are uninsured 87
Percent of licensed practical nurses in nursing homes and home care that are uninsured, compared with 5.1% of registered nurses 88
Among people whose jobs (and thus their insurance) were cut during the first months of the COVID-19 pandemic, the percent who were women 89
Percent of construction workers without health insurance in 2018 90
Percent of Latinx construction workers without health insurance in 2018. By comparison, 13% of White non-Latinx workers were uninsured 91
Increased likelihood construction workers have employment-based insurance if they are members of a union 92
Increased likelihood unionized construction workers have their premiums fully paid by their employers compared to non-unionized workers 93
Uninsured Moms and Kids
76 Fowers, Alyssa and Shelly Tan (March 19, 2020), “The New Sick Leave Law Doesn’t Help The Workers That Need It Most” The Washington Post,
https://www.washingtonpost.com/graphics/2020/national/sick-leave-workers-coronavirus/
77 Hernandez, Trish, and Susan Gabbard (January 2018), “Findings from the National Agricultural Workers Survey (NAWS) 2015-2016: A Demographic and Employment Profile of United States Farmworkers,”
https://www.dol.gov/agencies/eta/national- agricultural-workers-survey/research.
78 Rho, Hye (April 2020), “A Basic Demographic Profile of Workers in Frontline Industries,” Center for Economic and Policy Research,
https://cepr.net/wp-content/uploads/2020/04/2020-04-Frontline-Workers.pdf.
83 Vistnes, Jessica (September 2017), "Substantial Churn In Health Insurance Offerings By Small Employers, 2014–15," Health Affairs,
https://www.healthaffairs.org/doi/abs/10.1377/hlthaff.2017.0431
84 The figures come from PHI. Himmelstein and Woolhandler report a slightly lower figure, 14.9%, for home health care workers. See
PHI (September 8, 2020), “Direct Care Workers in the United States: Key Facts,” https://phinational.org/resource/direct-care- workers-in-the-united-states-key-facts/; Himmelstein, David U. and Steffie Woolhandler (April 28, 2020), “Health Insurance Status and Risk Factors for Poor Outcomes With COVID-19 Among U.S. Health Care Workers: A Cross-Sectional Study,” Annals of Internal Medicine 173, no. 5: 410–12.
https://doi.org/10.7326/M20-1874.
89 Sonfield, Adam, Jennifer J. Frost, Ruth Dawson, and Laura D. Lindberg (August 3, 2020), “COVID-19 Job Losses Threaten Insurance Coverage and Access to Reproductive Health Care for Millions” Health Affairs Blog,
https://www.healthaffairs.org/do/10.1377/hblog20200728.779022/full/.
90 Brown, Samantha (April 2020), “Health Insurance Coverage in the Construction Industry,” The Center for Construction Research and Training
https://www.cpwr.com/wp-content/uploads/publications/DataBulletin-April-2020.pdf
94 Guzman, Lina, Yiyu Chen, and Dana Thomson (September 2020), “The Rate of Children without Health Insurance Is Rising, Particularly among Latino Children of Immigrant Parents and White Children,”
https://www.hispanicresearchcenter.org/wp- content/uploads/2020/09/children-without-health-insurance-sep-2020.pdf.
95 Brooks, Tricia (February 12, 2019), “A troubling sign: Half a Million Fewer Kids Covered by Medicaid and CHIP in 2018,” Georgetown University Health Policy Institute Center for Children and Families,
https://ccf.georgetown.edu/2019/02/12/a- troubling-sign-half-a-million-fewer-kids-covered-by-medicaid-and-chip-in-2018/
96 Alker, Joan (November 21, 2018), “Nation’s Progress on Children’s Health Coverage Reverses Course.” Georgetown University Health Policy Institute Center for Children and Families.
https://ccf.georgetown.edu/2018/11/21/nations-progress-on-childrens- health-coverage-reverses-course/.
97 Ranji, Usha, Ivette Gomez and Alina Salganicoff (December 21, 2020), “Expanding Postpartum Medicaid Coverage,” Kaiser Family Foundation,
https://www.kff.org/womens-health-policy/issue-brief/expanding-postpartum-medicaid-coverage/.
Inequitable Coverage
Respective uninsurance rates for White, Black, Latinx, and Native people, people without high school degrees, people who are unemployed, and people without citizenship, respectively 98
Percent of the uninsured who lived in the South in 2017 (a region home to 38% of the U.S. population and 55% of the Black population) 99
Percent of Latinx kids with immigrant parents who were uninsured in 2018 (compared to 3.8% of non- Latinx White kids) 100
Percentage of Native children who were uninsured in 2017 (compared to 4.9% for White kids) 101
Likelihood that a low-income person on Medicaid will experience a period of uninsurance compared to a wealthier person on private insurance 102
Portion of uninsured people in California who have incomes below $25,000 103
Percent of previously incarcerated men who are entirely uninsured 104
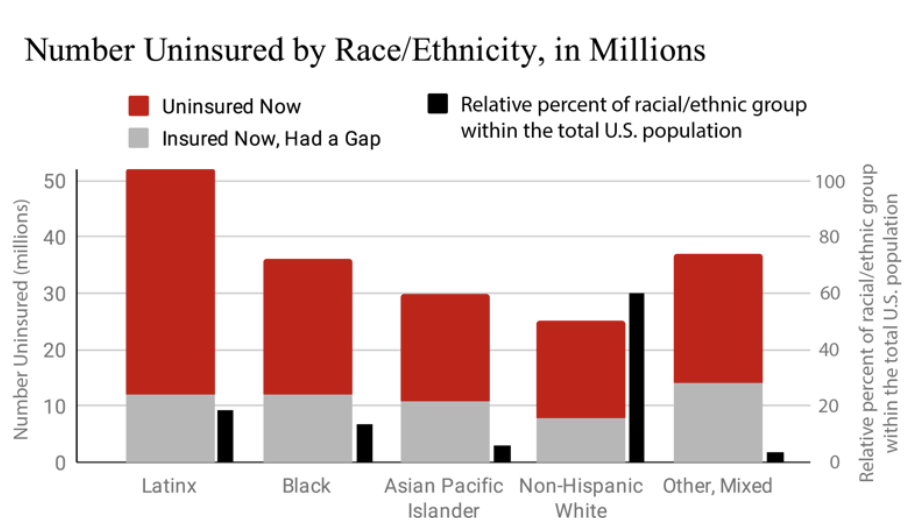 Source: The Commonwealth Fund
98 Note that the Census Bureau doesn’t include “U.S. civilians not residing in institutional group quarters facilities such as correctional institutions, juvenile facilities, skilled nursing facilities, and other long-term care living arrangements” in these counts. See Census Bureau, Table S2701, footnote 3.
99 See Blumberg (July 2018), footnote 3; The Census Bureau, “Population Clock,” https://www.census.gov/popclock/data_tables.php?component=growth.; The Census Bureau (Sept. 29, 2011), “2010 Census Shows Black Population has Highest Concentration in the South ,”
https://www.census.gov/newsroom/releases/archives/2010_census/cb11-cn185.html.
102 Austic, Elizabeth (November 2016), “Insurance Churning,” University of Michigan Poverty Solutions,
https://poverty.umich.edu/research-publications/policy-briefs/insurance-churning/?eType=EmailBlastContent&eId=d8ed9c6b-5b96- 4dcb-9008-08ce97578bcc
103 Fronstin, Paul (August 6, 2018), “2018 Edition — California’s Uninsured Progress toward universal coverage.” California Health Care Foundation,d
https://www.chcf.org/publication/2018-edition-californias-uninsured-progress-universal-coverage/
Precarity of Life Without Coverage and Care
Number of people who die unnecessary preventable deaths each year because they are left uninsured 105
Number of people who will die unnecessarily in the next 7 to 11 years if 30 million people continue to be left uninsured 106
Number of people who knew a friend or family member who died in the last five years after being unable to afford medical treatment 107
Estimated number of people who will die over the next 10 years from being uninsured if 12 states continue to block Medicaid expansion 108
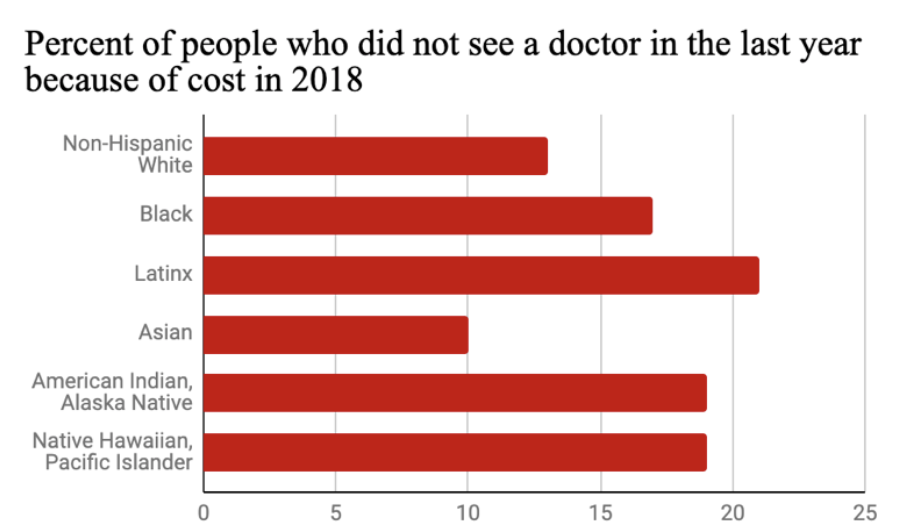
People without insurance avoided going to the doctor when they needed medical attention 109
Estimated number of people who would be able to become self-employed if they did not have to stay in their current job to keep their employer sponsored insurance 110
Number of people with diabetes who are uninsured. Not having insurance coverage in the U.S.’s pay-or- you-don’t-get-treatment health care system puts people with diabetes at serious risk of health complications and even death 111
Percent of married women who were insured as dependents (compared to 16% of men) 112
Percent chance a marriage won’t end in divorce even if there are marital issues if one spouse is dependent on the other for health insurance 113
People died every hour due to a lack of health insurance in 2010 114
Number of people who died prematurely due to a lack of health coverage between 2005 and 2010 115
105 45,000 per year according to Wilper et al. and 68,000 according to Galvani et al. Other studies estimate similar rates of preventable
deaths caused by policies that leave people uninsured. See Wilper, Andrew P., Steffie Woolhandler, Karen E. Lasser, Danny McCormick, David H. Bor, and David U. Himmelstein (December 2009), “Health Insurance and Mortality in US Adults” American Journal of Public Health 99, no. 12: 2289–95. https://doi.org/10.2105/AJPH.2008.157685; Galvani, Alison P., Alyssa S. Parpia, Eric M. Foster, Burton H. Singer and Meagan C. Fitzpatrick (February 15, 2020), “Improving the Prognosis of Health Care in the USA,” The Lancet 395, no. 10223: 524–33.
https://doi.org/10.1016/S0140-6736(19)33019-3.
107 Witters, Dan (November 12, 2019), “Millions in U.S. Lost Someone Who Couldn’t Afford Treatment,” Gallup,
https://news.gallup.com/poll/268094/millions-lost-someone-couldn-afford-treatment.aspx.
108 According to Miller at al., covering the uninsured through Medicaid expansion reduces people’s risk of death by 0.132 percent.
According to Kaiser Family Foundation, 3,999,000 people will be left uninsured by twelve states’ refusal to expand Medicaid after Missouri’s and Oklahoma’s pending expansions. See Miller, Sarah, Norman Johnson, and Laura Wherry (July 2019), “Medicaid and Mortality: New Evidence from Linked Survey and Administrative Data,” Cambridge, MA: National Bureau of Economic Research, July 2019. https://doi.org/10.3386/w26081.; Kaiser Family Foundation (January 23, 2020), “Who Could Get Covered Under Medicaid Expansion? State Fact Sheets,”
https://www.kff.org/medicaid/fact-sheet/uninsured-adults-in-states-that-did-not- expand-who-would-become-eligible-for-medicaid-under-expansion/.
109 Tepper, Taylor (August 8, 2018), “Most Americans are worried about their health insurance — especially women” Bankrate,
https://www.bankrate.com/insurance/health-insurance-survey-august-2018/
110 Baker, Dean (March 2015), “Job Lock and Employer-Provided Health Insurance: Evidence from the Literature,” AARP Public Policy Institute,
https://www.aarp.org/content/dam/aarp/ppi/2015-03/JobLock-Report.pdf
111 Casagrande, Sarah S., Laura N. McEwen, and William H. Herman (May 1, 2018), “Changes in Health Insurance Coverage Under the Affordable Care Act: A National Sample of U.S. Adults With Diabetes, 2009 and 2016,” Diabetes Care 41, no. 5: 956–62,
https://doi.org/10.2337/dc17-2524.
114 Families USA (June 2012), “Dying for Coverage: The Deadly Consequences of Being Uninsured,
https://familiesusa.org/wp- content/uploads/2019/09/Dying-for-Coverage.pdf.